


What we cover

Most of the fuel retailers we work with are extremely proactive when it comes to using data to make business decisions. Collecting the data they need usually isn’t a challenge; they either handle it internally or enlist a third party to help. Instead, the challenge lies in organizing and structuring that data in a way that provides meaningful and actionable insights into their business.
Tools like the Upside Dashboard help set a higher standard for measuring partner performance. Our Dashboard gives your program owners, finance personnel, marketing managers, and data analysts the specific, concise information they need to make smart investment decisions.
Upside is redefining measurement
With the Dashboard, it’s easier than ever to see how Upside influences customer behavior at your stations.
Upside uses a rigorous “test versus control” methodology at the individual user level — across millions of customers and hundreds of thousands of locations — to accurately measure behavior change and impact on your bottom line.
Our Dashboard shows how our platform is driving real, incremental value for your business.
Dashboard benefits
- At-a-glance insights: You don’t have to search through pages of data. Get the insights you need with simple, clear takeaways that answer your questions.
- More customer data: Double-click into your different customer segments — whether they’re new, lapsed, or loyal — to see how they’re behaving.
- Deeper insights by individual station or region: Our interactive data visualizations go beyond the surface. Dive deep and see Upside’s impact on a granular level.
What you’ll find in the Upside Dashboard
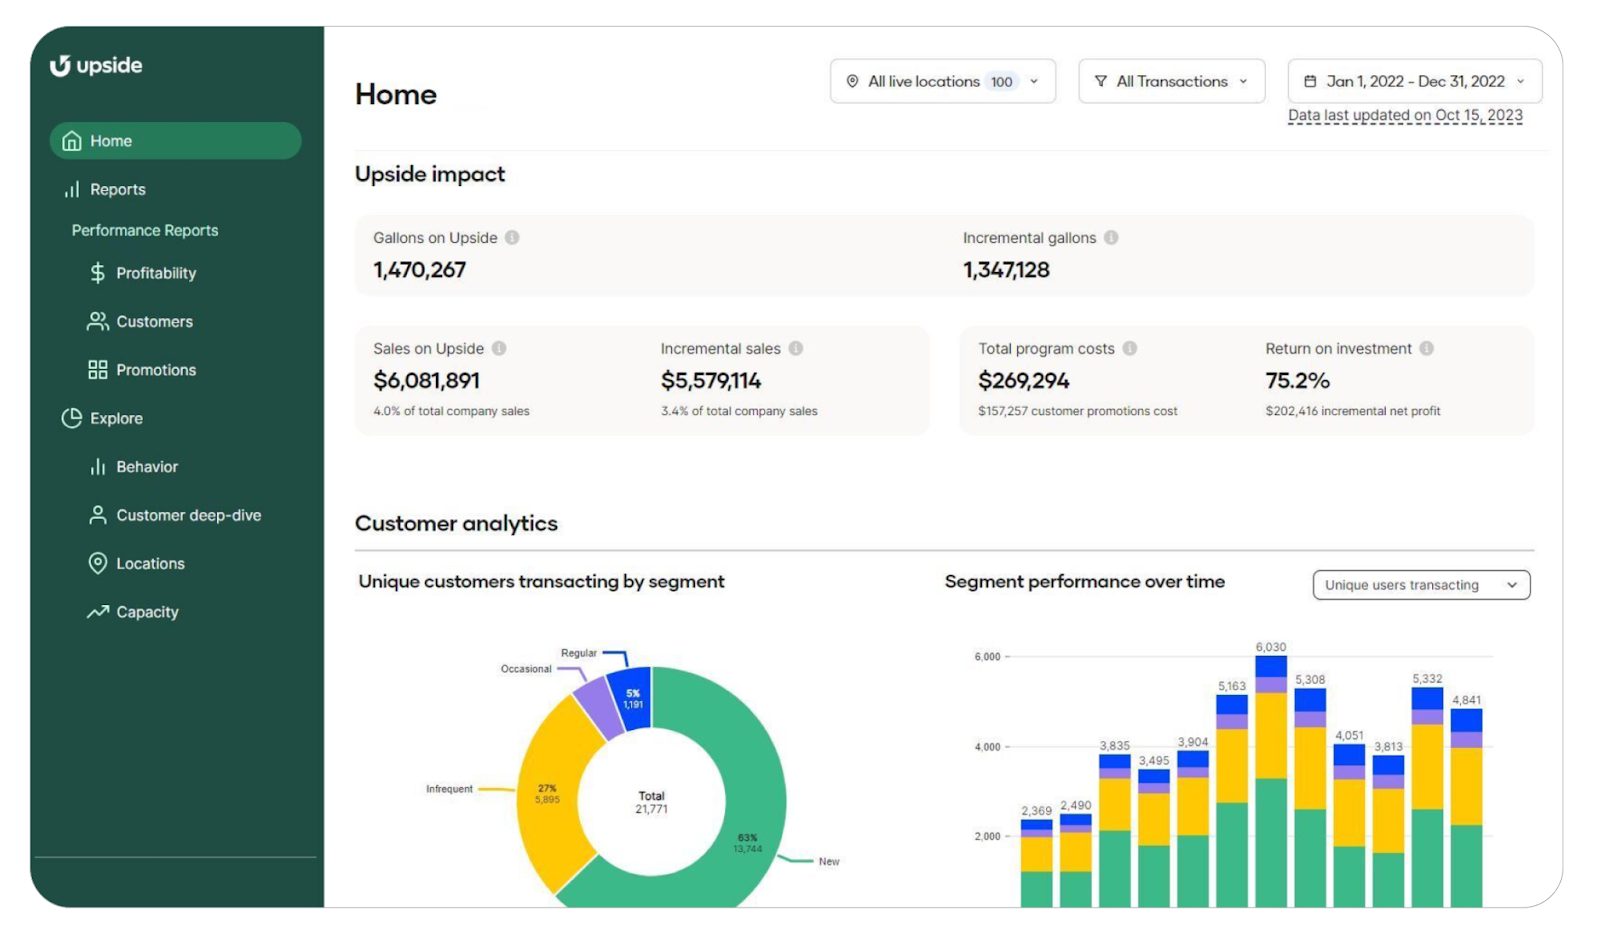
Key performance indicators: The Home page is your one-stop shop for key performance indicators, including sales lift, customers acquired, monthly trends, and bottom-line impact.
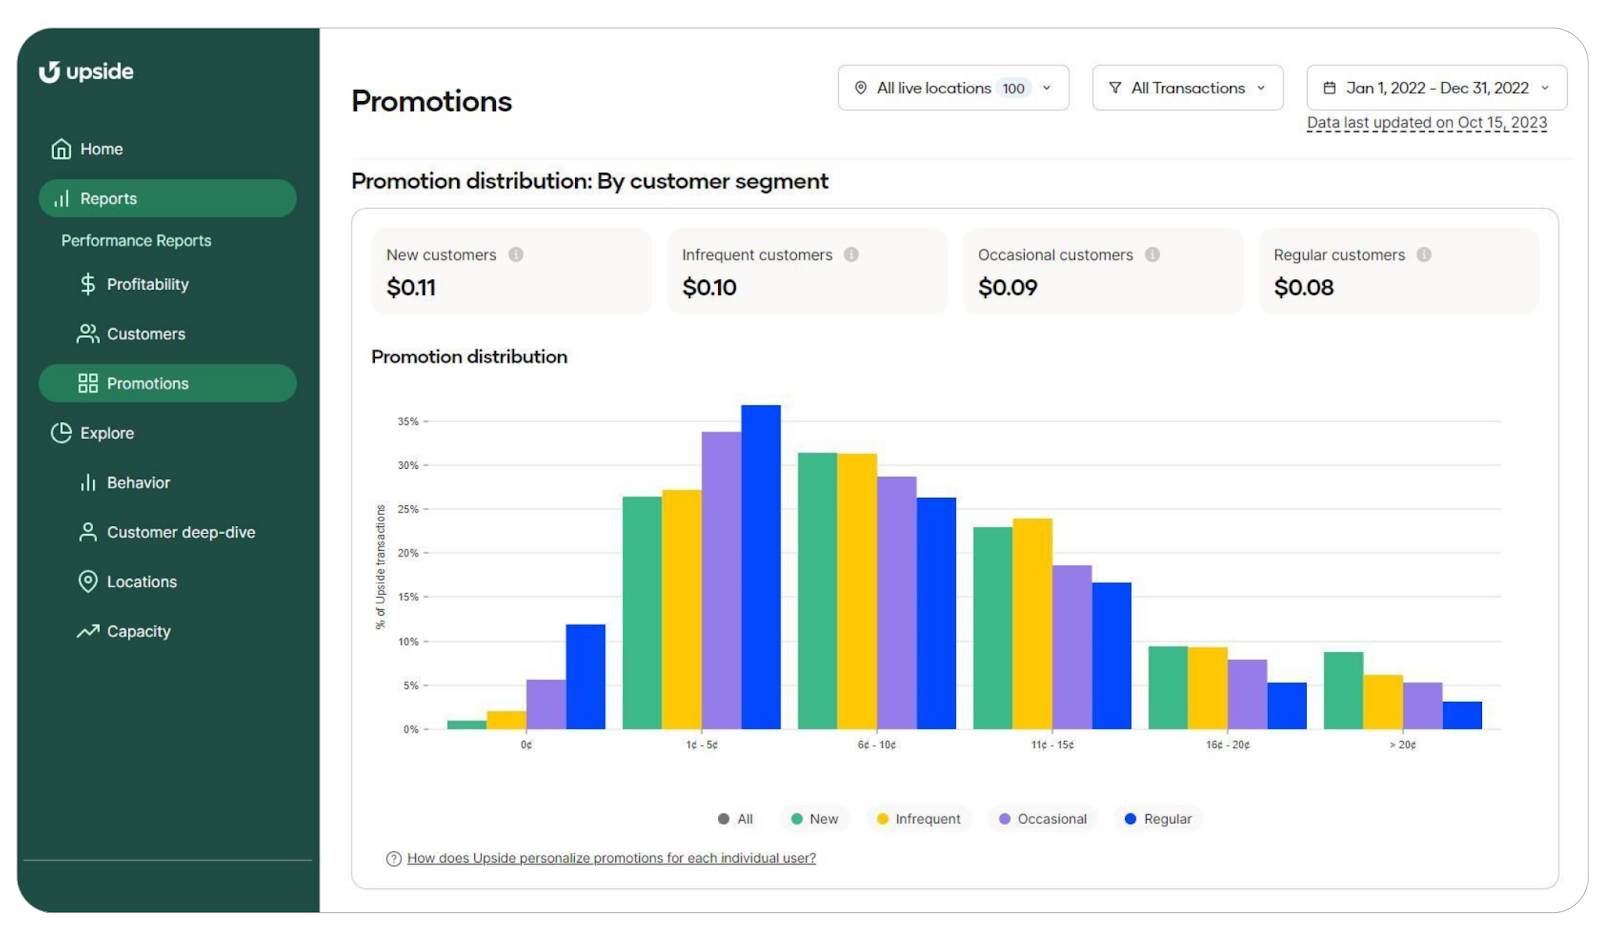
Personalized promotion performance: The Promotions page highlights margin-bound, personalized offers in action. See which promotions are claimed by each type of customer and how your offers change over time.
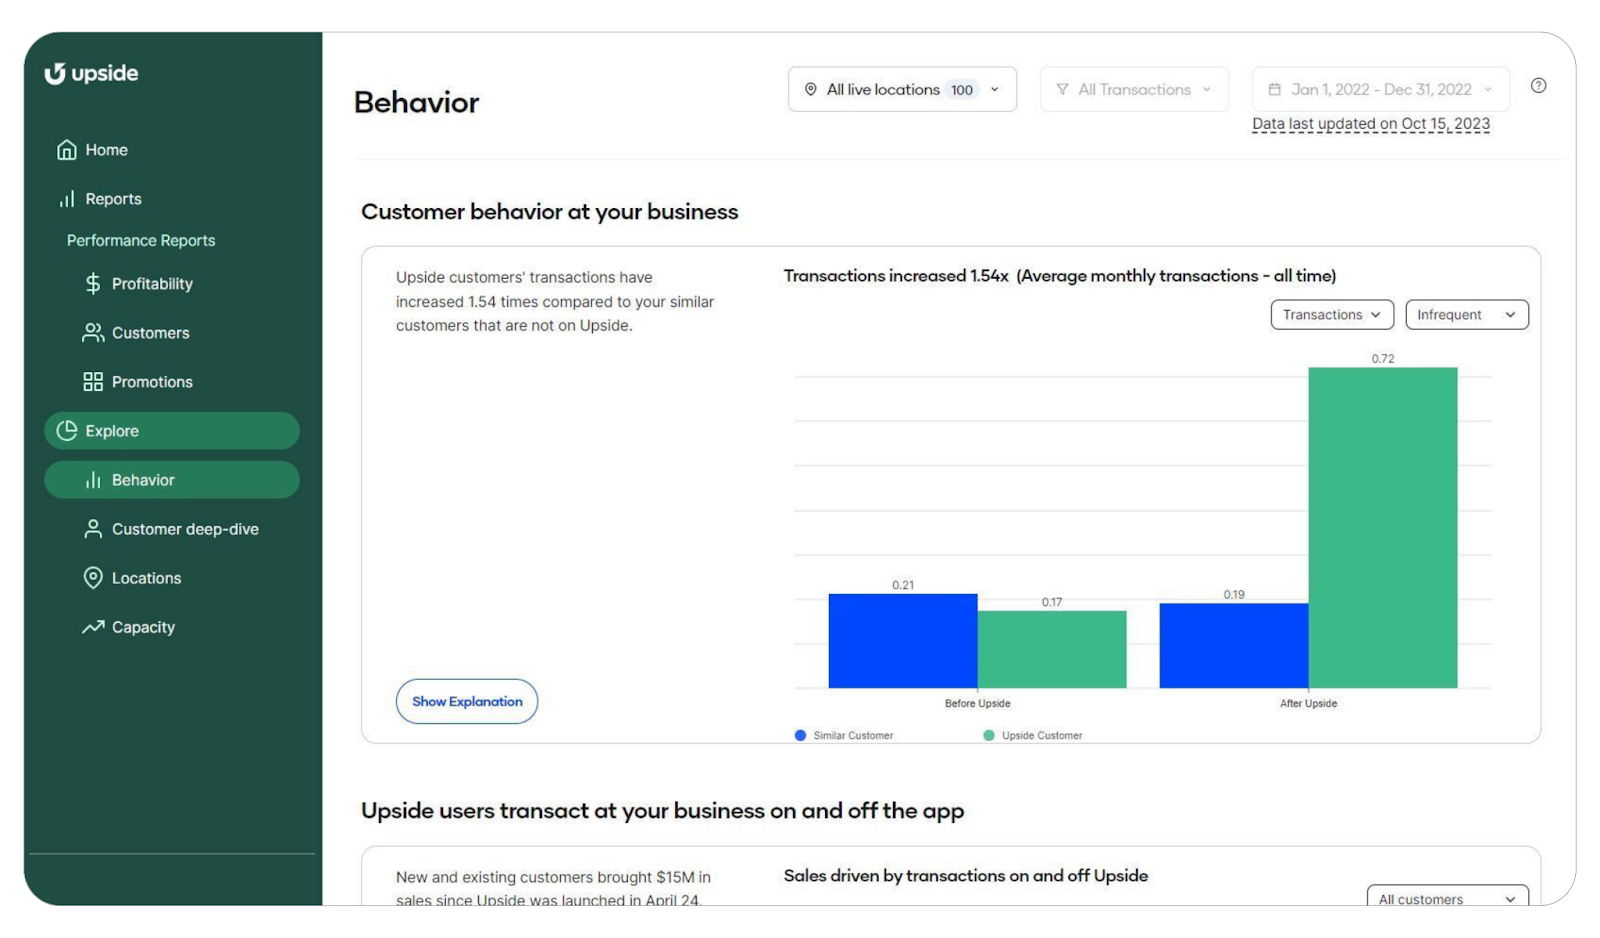
Customer behavior change: The Behavior page visualizes how your customers act, including whether they transact off the Upside app. You can quantify Upside’s value by isolating program impact from factors that influence your business’ performance each day.
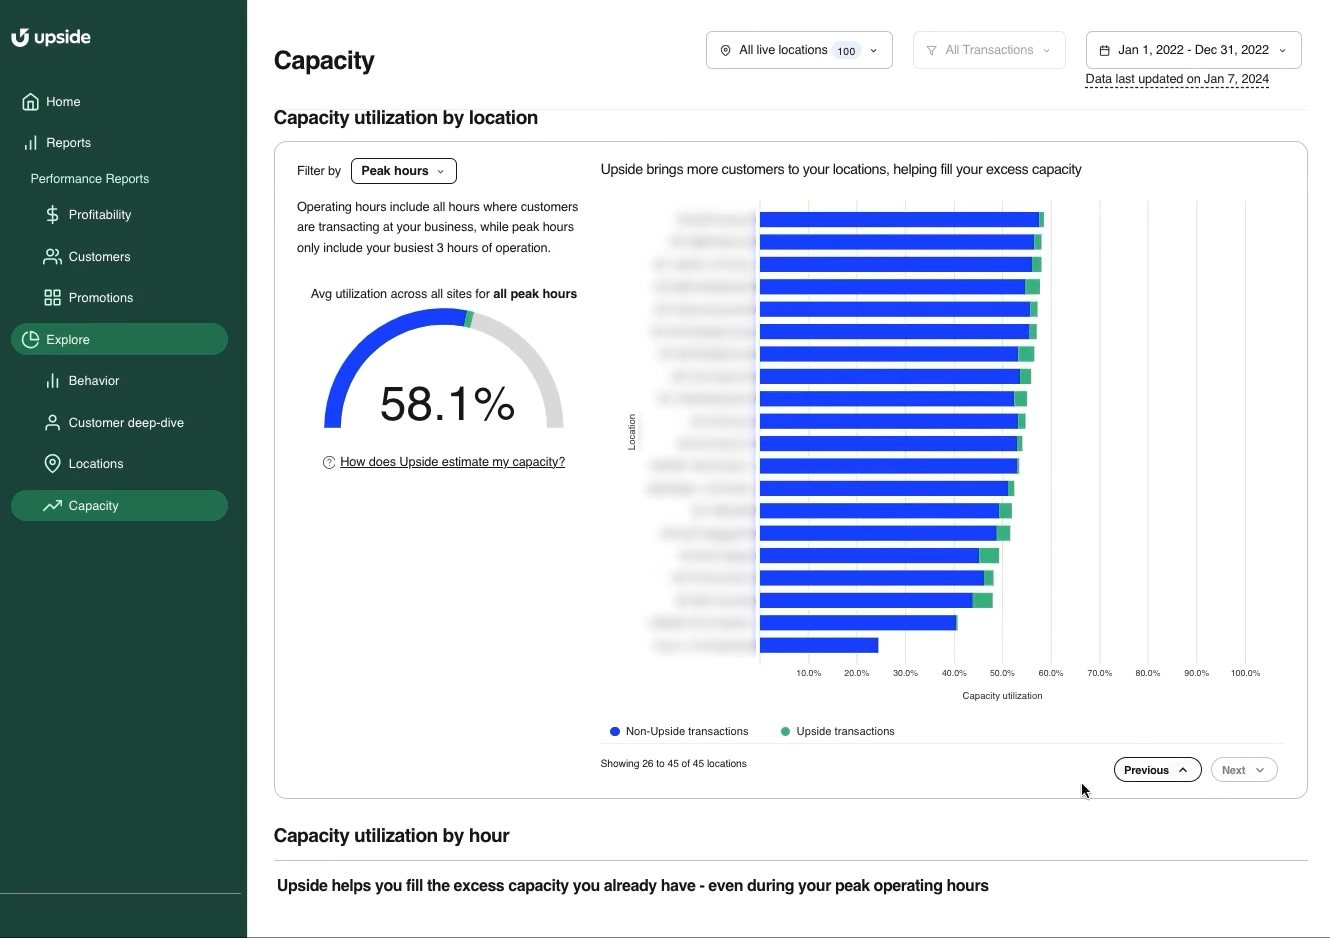
Capacity utilization: The Capacity page measures pump utilization across your business and shows the impact Upside is having on filling your idle pumps with new volume.
See the Dashboard for yourself
Get in touch and we’ll have someone on our team of experts reach out.


Request a demo
Request a demo of our platform with no obligation. Our team of industry experts will reach out to learn more about your unique business needs.

