
The income divide: Retail behavior is splitting in two

Download the report
The income divide: Retail behavior is splitting in two
Consumer demand looks stable on the surface. But underneath, it’s splitting in two. This report reveals how spending and decision-making are diverging across income levels, and what that means for retailers.
Get your copy of the report
Why the “average customer” doesn’t tell the full story
Retailers often plan around averages, but those averages are masking a growing behavioral divide. Higher-income consumers are increasing spend. Lower-income consumers are pulling back — making fewer trips and focusing on price. Both groups seek value, but they define it differently. That difference is reshaping how customers decide where and when to shop.
$75k
in household income marks where spending behavior begins to diverge.
46%
of high earners say the economy is improving, compared to 22% of low earners.
24%
of consumers are increasing spend, while 51% say they’re cutting back.

Key takeaways
- What’s behind the income divide
- How spending and decision-making differ across income levels
- How economic outlook vary between household income groups
- What value means to different customers
- Why broad promotions miss the mark
- How personalization shifts how customers respond
Get your copy of the report
Download the report

Why the “average customer” doesn’t tell the full story
Retailers often plan around averages, but those averages are masking a growing behavioral divide. Higher-income consumers are increasing spend. Lower-income consumers are pulling back — making fewer trips and focusing on price. Both groups seek value, but they define it differently. That difference is reshaping how customers decide where and when to shop.
$75k
in household income marks where spending behavior begins to diverge.
46%
of high earners say the economy is improving, compared to 22% of low earners.
24%
of consumers are increasing spend, while 51% say they’re cutting back.
Why the “average customer” doesn’t tell the full story
Nearly 80% of today’s retail customers are uncommitted, shopping across brands and formats in order to maximize their own value. Long-term growth depends on understanding and influencing them — profitably. This new report shows you how.
Select your industry
Grocery
Most grocers’ retention buckets are leakier than they think.
For grocers, 31% of their customers in a given month will churn — even more so for new customers. Loyalty programming helps, but significant churn risks remain.
- 31% of all customers shopping in a given month won't be back that year
- 50% of new customers shopping in their first month won't be back that year
- 14% of loyalty members shopping in a given month won't be back that year

Restaurant
Most restaurants’ retention buckets are leakier than they think.
For restaurant retailers, 42% of their customers in a given month will churn — even more so for new customers.
- 42% of all customers shopping in a given month won't be back that year
- 64% of new customers shopping in their first month won't be back that year

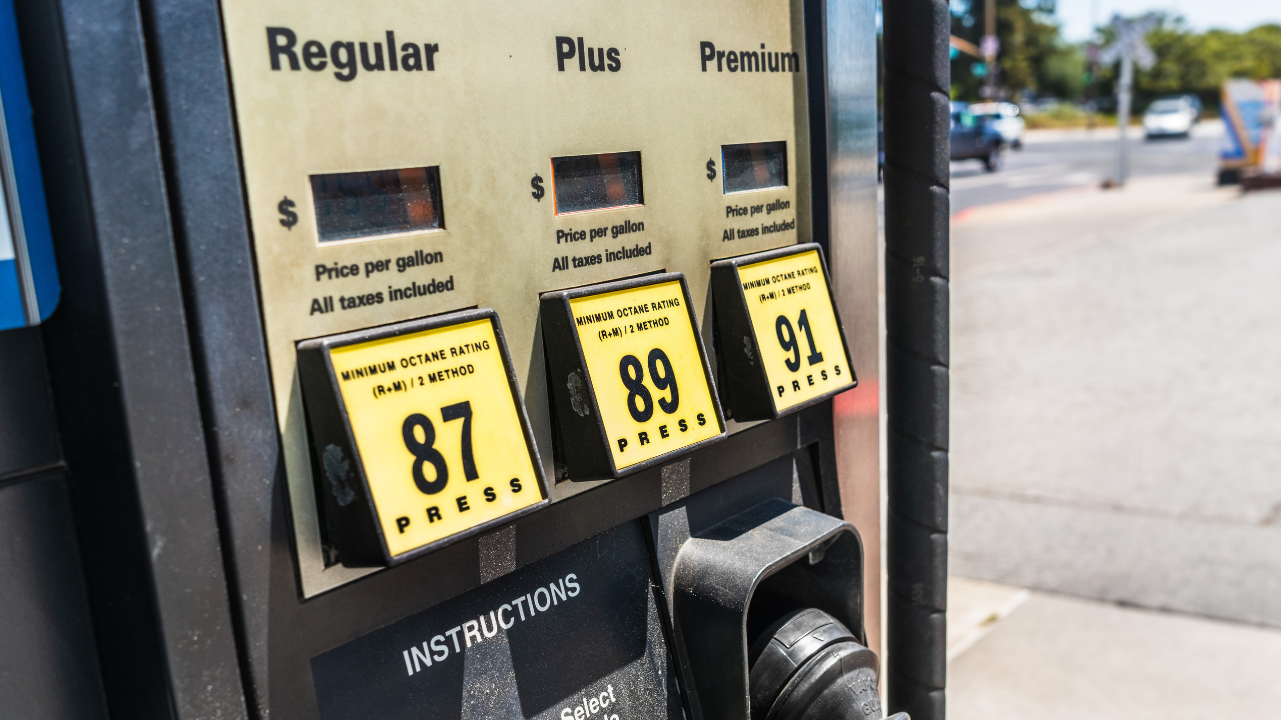
Fuel
Most fuel retailers’ retention buckets are leakier than they think.
For fuel retailers, 51% of their customers in a given month will churn — even more so for new customers. Loyalty programming helps, but significant churn risks remain.
- 51% of all customers shopping in a given month won't be back that year
- 64% of new customers shopping in their first month won't be back that year
- 20% of loyalty members shopping in a given month won't be back that year

46%
of high earners say the economy is improving, compared to 22% of low earners.
New data reveals the key to higher retention rates.
Retained customers spend at higher levels than new customers

Source: Upside transaction data from 7.7 million customers at 335 grocery stores, 2,254 fuel stations, and 1,498 restaurants from March 2022 to February 2025.
Key takeaway
Customer retention is about building habits, visit by visit. Our research shows regular grocery customers are 46 percentage points more likely than new customers to stick around after a year — and that compounds over time.

