


What we cover

Every once in a while, major global events send fuel headlines to the top of the news. We’re in the midst of one of those stretches now. On February 28th, the United States and Israel attacked Iran, sparking a conflict now spreading across the Middle East.
Although we’re ostensibly here to review the fuel trends of February — which were largely cemented before the attacks took place — we’ll consider the fast-moving March oil news and what it means for the future. We’ll also explore slumping diesel sales, an area of concern for many retailers.
Read on for the latest in fuel.
Last month’s data
Prices tick up as the seasonal rally begins
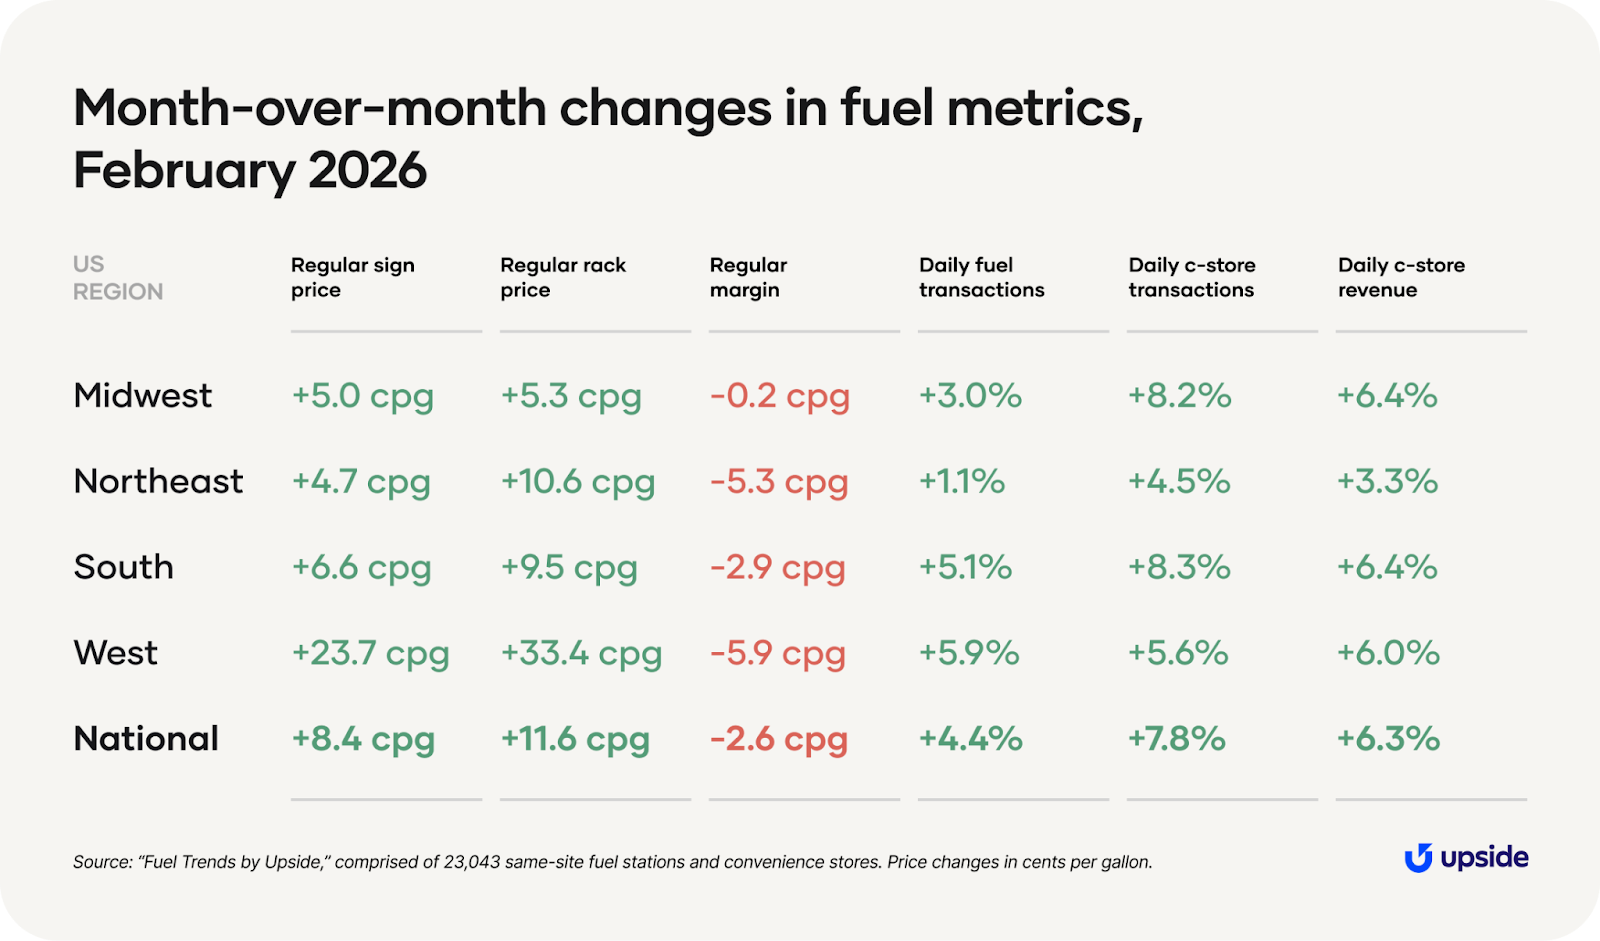
Our data shows that regular rack prices rose nearly 12 cents per gallon at the average American station, with fairly substantial increases in all regions. This is expected — the early spring thaw of February leads to rising daily demand across the country.
The West is the biggest driver of these increases, as rack prices rose a whopping 33 cents per gallon. That’s because of refinery maintenance in California. Due to the state’s more strict environmental standard, it makes an earlier transition to summer blend gasoline (on April 1st — no joke). Rack prices increase when refinery maintenance begins in preparation for the transition. For reference, the West experienced a 24-cent increase over the same period in 2025.
As usual, sign prices move slower than rack prices. That left us with an average increase of 8 cents per gallon in American sign prices — once again, with prices increasing across all regions. The slower rise in sign prices relative to rack prices meant that margins were compressed in February. For the average national station, regular-grade margin dipped by about 3 cents per gallon.
How about on the demand side? With January lows behind us, the long uptick in foot traffic begins as fuel and c-store transactions begin their annual summer rally.
The average national station saw a 4% daily increase in fuel traffic month-over-month, with higher increases in regions that got warm earlier. Stations out West and down South were up 6% and 5%, respectively. Colder regions, meanwhile, experienced more modest increases — a 1% increase for Northeast stations and 3% boost in the Midwest.
Convenience traffic also saw healthy seasonal gains with the average American c-store seeing 8% more transactions compared to January. That transaction boost translated to 6% more revenue month-over-month.
A concerning dip in diesel demand
A tumultuous March is already underway, and we’re going to explore those trends in more detail soon. But let’s first take a look at where diesel trends were headed before the recent spike in oil prices.
First, why does diesel matter? On the whole, diesel customers deliver higher margins per gallon and more gallons per visit. Many stations rely on these customers to boost their bottom lines. If stations lose revenue from diesel sales, they are left with one less tool to fight against the broader decline in conventional grade gasoline demand.
Diesel is also an indicator for the U.S economy. While regular grade demand tends to reflect household economic activity, diesel reflects commercial economic activity. A decline in diesel volume signals weakening demand for consumer goods. Rising diesel prices, on the other hand, can pass through to the costs of goods that are harvested by diesel-powered tractors, driven by diesel-powered trucks, or transported by diesel-powered ships.
For much of 2025, our data shows that average diesel volume at the average American gas station rose. But diesel sales started to decline in October, and that trend has continued to the present. From October to February, volume fell year-over-year by an average of about 3%.

Believe it or not, this is an optimistic outlook for diesel. Compare our numbers to the American Truckers Association, which reported that trucking tonnage only grew by 0.1% in 2025 compared to the previous year.
We see that diesel declines were heavily dependent on region. Stations in the South and West were disproportionately responsible for the drop in volume, while volume in the Midwest and Northeast has actually been increasing in recent months.
What’s behind the decline?
It could be due to weakened demand for goods. In our recent Consumer Spend Report, we discussed the “income divide” — higher-income households are reporting increased spend which is masking a pullback by lower-income customers. Higher-income households spend a disproportionate share on services, while lower-income households spend a greater income share on physical goods. This divide may be driving lower demand for transportation of these physical goods, and as such, lower demand for diesel.
Another reason is the exceptionally cold winter that’s plagued the eastern seaboard. For one, major storms made highway travel more difficult. Additionally, the cold weather drives up demand for heating oil, which is a close substitute for diesel — increasing the price of both.
And the recent drop in diesel demand per station corresponds closely to rising diesel prices. Compare the above chart plotting diesel volume to the one below, which tracks diesel prices over the same period.

Predictions and considerations
The wider impact of war on the fuel industry
We’ve alluded to the ongoing conflict in the Middle East, one that could dominate the conversation around the fuel industry in the coming weeks and months.
On Monday, March 9th, the price of West Texas Intermediate oil surged over $100 per barrel, a 40% increase over the prior week. It sat at its highest level overall since 2022. Though prices have settled a bit at the time of this publication, they’re still considerably higher than they were prior to the initial strikes.
Even without this conflict, we would have expected sign prices to increase. Remember how rack prices moved quicker than sign prices in February — those sign prices will catch up in March. War in the Middle East will drive up prices that were already expected to go up.
We’ll keep an eye on this and provide a full recap on the impact of war for fuel retailers and consumers.
Potential tailwinds:
1. March brings the end of winter, and warmer weather brings more drivers onto the roads. Other things equal (which is a major assumption), we expect to see fuel demand rise through the summer.
2. In the aftermath of the attack on Iran, OPEC+ committed to further increases in fuel production. That supply increase could offset a small portion of the impact of the war.
Potential headwinds:
1. The Middle East looms large. In particular, we’re following events in the Strait of Hormuz, a narrow waterway off the southern coast of Iran. Oil tankers transport fuel from the Persian Gulf through this waterway, but Iran has effectively closed the Strait and cut off supply from that region. If this closure lasts a while, the global supply of fuel will be severely impacted.
2. We’re heading into refinery maintenance season as much of the country begins its preparation to switch to summer-blend fuel. This results in lower supply during this time, but the market expects and plans for it each year.
Subscribe for monthly trend updates
Check out our insights hub with all our fuel and convenience monthly updates, or fill out the form below to subscribe to monthly fuel and c-store insights.


Request a demo
Request a demo of our platform with no obligation. Our team of industry experts will reach out to learn more about your unique business needs.

