


What we cover

Coming off a very back-and-forth June, July was slated to get off to a hot start for fuel retailers with the Fourth of July holiday. Industry data shows that the weekend was a strong one — but in all, it was an average month at the pump. We did see an uptick in transactions and revenue inside the convenience store, though, which gave us a reason to look closer at inside trends.
Continue reading for a full recap of fuel in July.
Last month’s data
Relative stability, with encouraging upticks inside the store
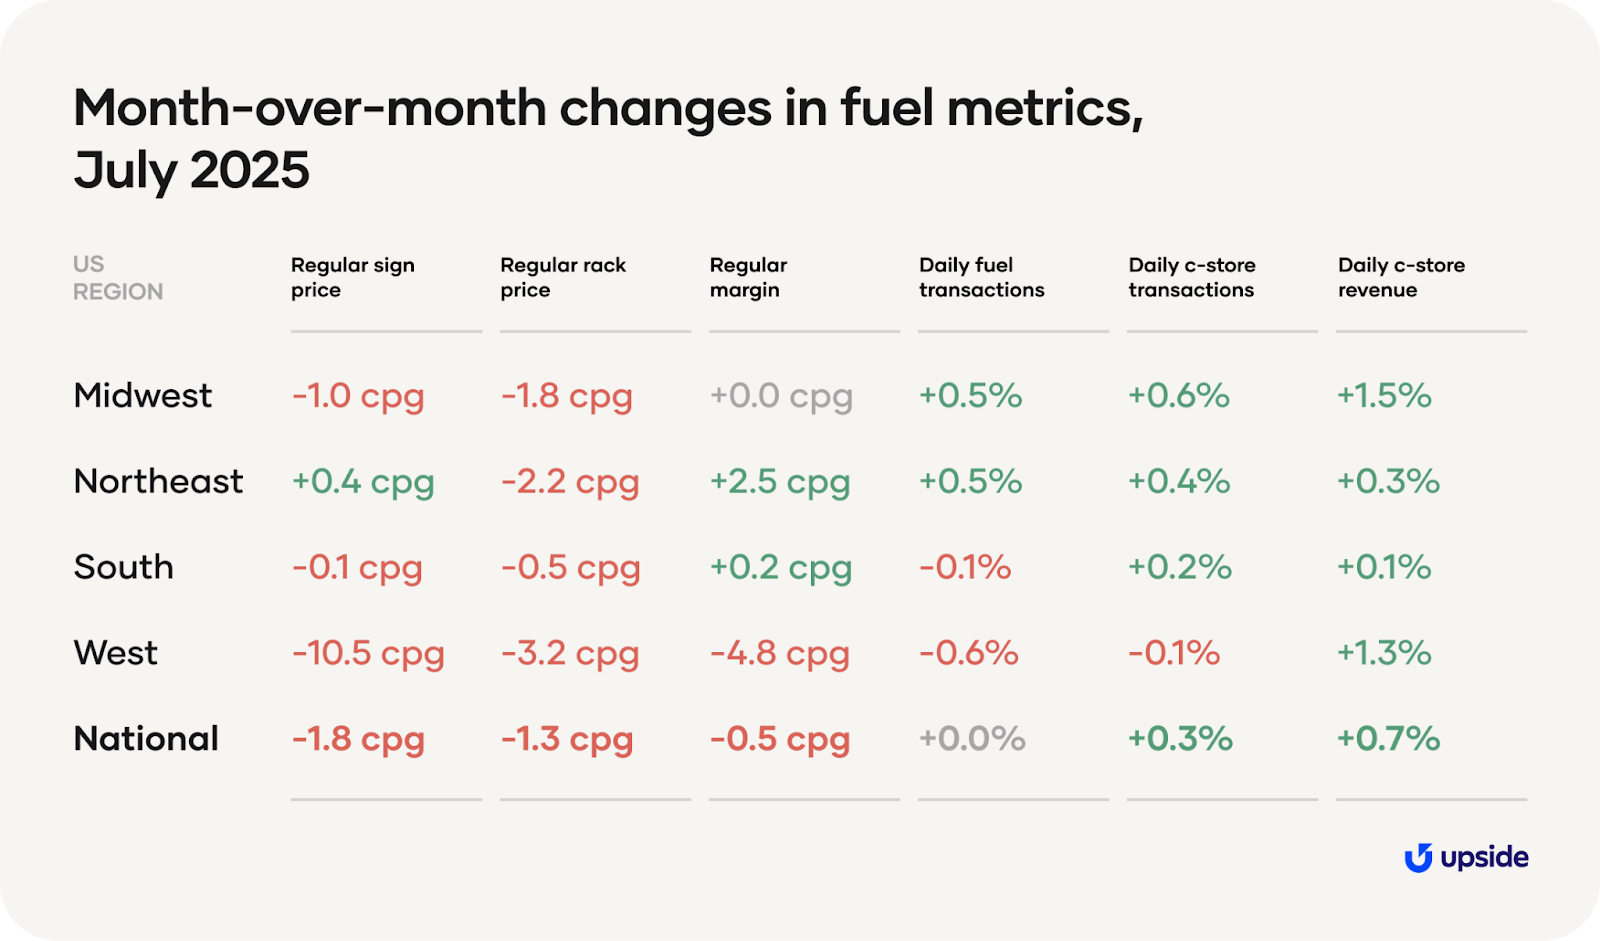
Fuel prices and margins
First, we’ll take a magnifying glass to sign prices. With the exception of a slight bump in the Northeast, sign prices for regular fuel dipped across the country over the past month. The drops were modest in the Midwest and South, where we saw decreases of a cent per gallon or less.
In the West, however, stations saw considerable declines of more than 10 cents per gallon. This is not a surprise; if you’ll recall, rack prices in the West fell dramatically in June. Changes in sign prices generally lag a bit behind changes in rack prices, so we’re seeing the impact of those rack price decreases one month later here.
The change in the national average for fuel margins, then, perfectly reflects the combined month-over-month changes in sign prices and rack prices.
Ultimately, we’re seeing pretty reliable stability in fuel prices this summer. We can chalk that up to a few things:
1. First, crude oil prices have been stable. The price of West Texas Intermediate crude only increased 22 cents per barrel (in other words, half a penny per gallon) from June to July.
2. Second, fuel demand is unchanged, as our data above is showing flat month-over-month figures for daily fuel transactions.
3. Finally, American refineries had high utilization rates of 95%, showing that they were producing enough fuel to meet elevated summer driving demand.
Fuel transactions
On the transaction front, July got off to a hot start with the Fourth of July holiday, a big weekend for summer travel. In fact, AAA predicted a record 72.2 million travelers for the occasion.
Despite that projection, though, our data shows flat month-over-month changes in fuel demand. Transactions seemed to have leveled off for the rest of the month, resulting in no change from June for the average station.
Compared to the previous July, this one was actually rather slow. Looking year-over-year, we see 1.9% fewer fuel transactions per station in July 2025 relative to July 2024.
Convenience store transactions and revenue
On the other hand, c-stores experienced a modest boost in the last month. The average c-store saw a 0.3% increase in daily transactions and a 0.7% increase in daily revenue from June to July, with the highest daily visits and revenue occurring on the Friday before the Fourth.
A closer look at c-store transactions
With this one-month uptick in convenience traffic, we wanted to dig more into the average transaction at a typical c-store. In this section, we’ll be evaluating year-over-year changes, comparing the first seven months of 2025 to the same period in 2024.
But first, an important note about our data. This month’s recap is pulling transaction logs from 22,507 gas stations and c-stores in the United States. Item names can vary wildly by retailer, so we sort transactions by fuel and non-fuel, but not by product category. For that reason, we focus our analysis only on the number of items and their prices. For more information, see our methodology page.
Average c-store revenue per transaction in 2025
To begin, the chart below plots average revenue per transaction for the average c-store. When we sum the averages from each month to get yearly averages, we see that spending per transaction is 12 cents higher so far in 2025 ($12.13) than in the same months in 2024 ($12.01).
This small, 1.0% increase in spending per transaction seems modest — especially when compared to the 2.6% all-item inflation rate over the same time period.
Average c-store revenue per item in 2025
The above chart only reflects trends at the transaction level. When we dig into revenue per item, then we see larger increases. That’s captured in the chart below.
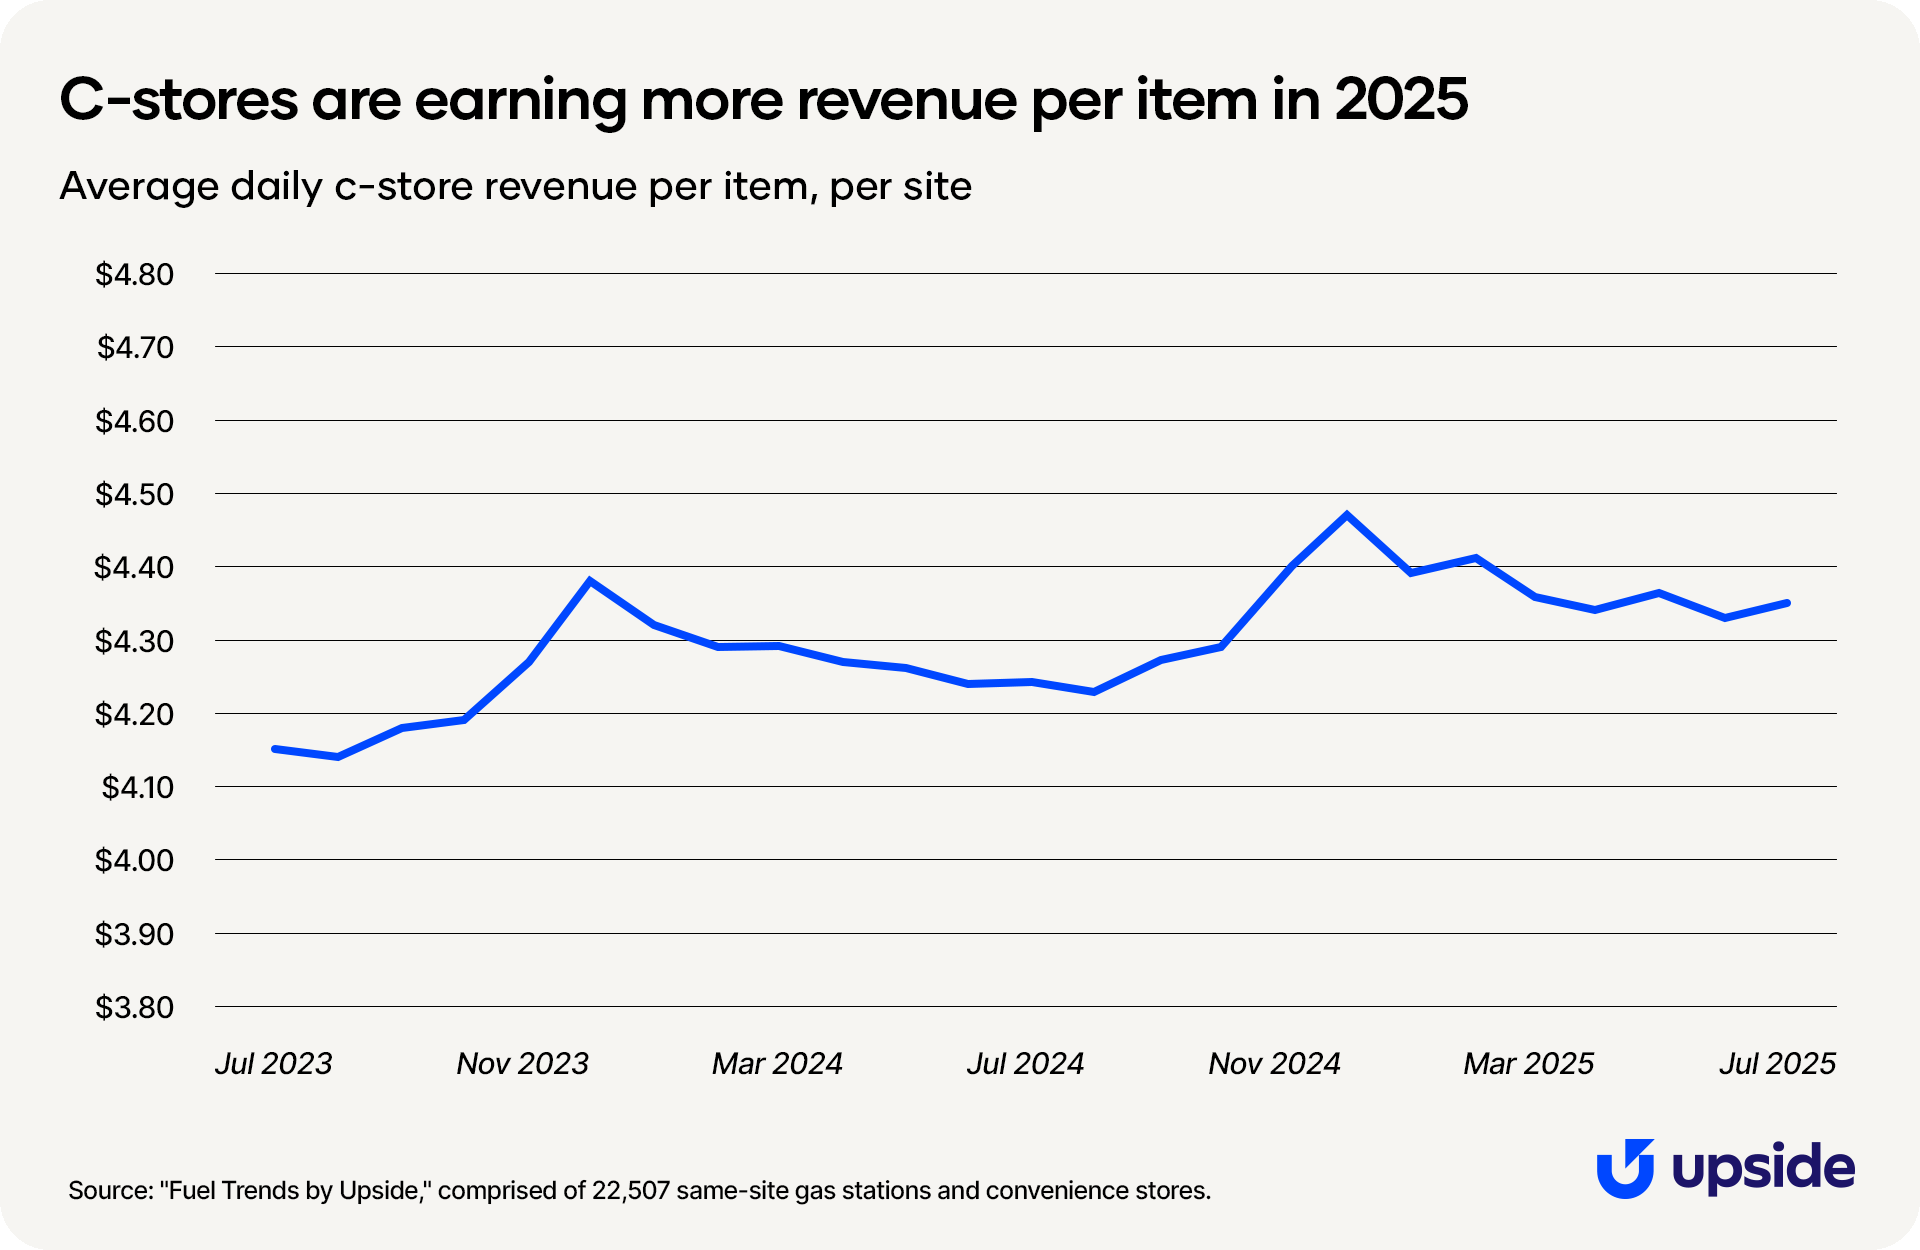
Average revenue per item through July 2025 stands at $4.36 compared to $4.27 through July 2024, an increase of 9 cents per item year-over-year. That 2.1% increase in spending per item is an improvement over revenue per transaction but still lower than overall inflation.
Based on the data available to us, it’s not clear to us whether average c-store prices increased by that amount or if price increases were even larger but consumers traded down to purchase lower-cost items.
Average c-store items per transaction in 2025
On the note of price increases, we see that consumer behavior changed in response to bigger totals at the register. Although c-stores are earning more revenue per item, consumers are reacting to higher prices by purchasing fewer items each trip.
So far in 2025, the average c-store transaction included 0.03 fewer items for 2.78 total items per basket, down from 2.81 items per basket compared to the start of 2024. That represents a 1.1% decline year-over-year. And while modest — note the granularity of the vertical axis above — it’s still a trend worth paying attention to.
Retailers planning to raise prices should take note: Consumers are increasingly reacting to price hikes by reducing the number of items they purchase.
Predictions and considerations
Looking steady as we close the book on summer
Barring unexpected developments like hurricanes or newly issued sanctions, we expect little change over the summer months. Seasonal fuel demand is highest between May and August, and generally the month-to-month metrics remain pretty stable during that time.
With that in mind, we believe that sign and rack prices will remain about the same or lower in August 2025. Economic indicators are pointing to weaker growth, which will have downward effects on demand for fuel. Additionally, we’re seeing continued negative effects from tariffs that have been implemented on American imports.
Potential tailwinds:
1. Refinery utilization is high right now at 95%, indicating that American oil refineries are processing fuel nearly at maximum capacity.
2. Sign prices are currently low partially due to weakening economic growth. When prices are low, consumers tend to buy more fuel — but in this case, there’s a catch. More on that below.
3. We’re still seeing high global supply of crude oil from OPEC+ countries. As long as supply remains high, prices can remain at lower levels.
Potential headwinds:
1. The flip side of the weakening economic growth that we’re experiencing is that consumer demand for fuel is lower at the moment.
2. We haven’t seen a major hurricane strike the United States yet, but the season continues through November. If a major weather event were to occur, both supply and demand for fuel could be disrupted.
3. In an effort to pressure Russia to end its war in Ukraine, President Trump has floated possible new sanctions on Russian oil. He has already levied additional tariffs on other countries who purchase it. Russia is the second-biggest producer of crude oil in the world, after the United States; any sanctions would make it more difficult for the country to export oil.
Want a closer look at the data?
Check out our insights hub with all our fuel and convenience monthly updates, plus special industry reports.


Request a demo
Request a demo of our platform with no obligation. Our team of industry experts will reach out to learn more about your unique business needs.

