

What we cover

With Memorial Day Weekend in the rearview mirror, June marks a summer driving season that’s in full swing. If you look at the metrics for June in the fuel industry, you’d see that things were relatively stable for most American regions month-over-month. However, heightened (then quickly cooled) conflict in the Middle East substantially impacted both retailers and consumers over the course of two weeks.
Read on for a full recap of fuel trends in June, complete with an analysis of the impact of the fighting between Israel, Iran, and the United States.
Last month’s data
Stable on the surface, but wild swings within the month

When we look at the whole picture for June, most regions of the United States saw relatively little change month-over-month. In the Midwest, Northeast, and South, sign prices for regular fuel were either flat or increased by less than two cents per gallon. Rack prices, too, held relatively steady, and so margins were similar month-over-month, as well.
The West, however, was a notable exception. The region’s fuel supply had been snarled in recent months due to two large refinery fires, which further stressed an already-constrained region. Facing a shortage in supply, prices had to rise in California in order to incentivize new fuel shipments to come in from the Gulf Coast and Asia.
In June, supply normalized, and with it, so did prices — welcome news for both drivers and retailers. Rack prices in the West dropped a remarkable 22 cents per gallon, and sign prices fell more than eight cents per gallon. Those changes resulted in a dramatic improvement in margins, which increased by more than 11 cents per gallon month-over-month.
On the transaction front, the Northeast saw the largest month-over-month increase in June with card transactions per station up 4.2% at the pump and 3% inside c-stores. All American regions saw an increase in c-store traffic, leading to a boost of 0.6% in the national average of card transactions per site. This was balanced out though by a modest 0.6% decrease in fuel transactions — signaling that summer demand for fuel has stabilized.
The impact of international conflict
However, these numbers don’t necessarily paint an accurate picture of the sizable swings we experienced in June. Despite the flat national changes from May, we saw a lot of intra-month turmoil following heightened tensions in the Middle East.
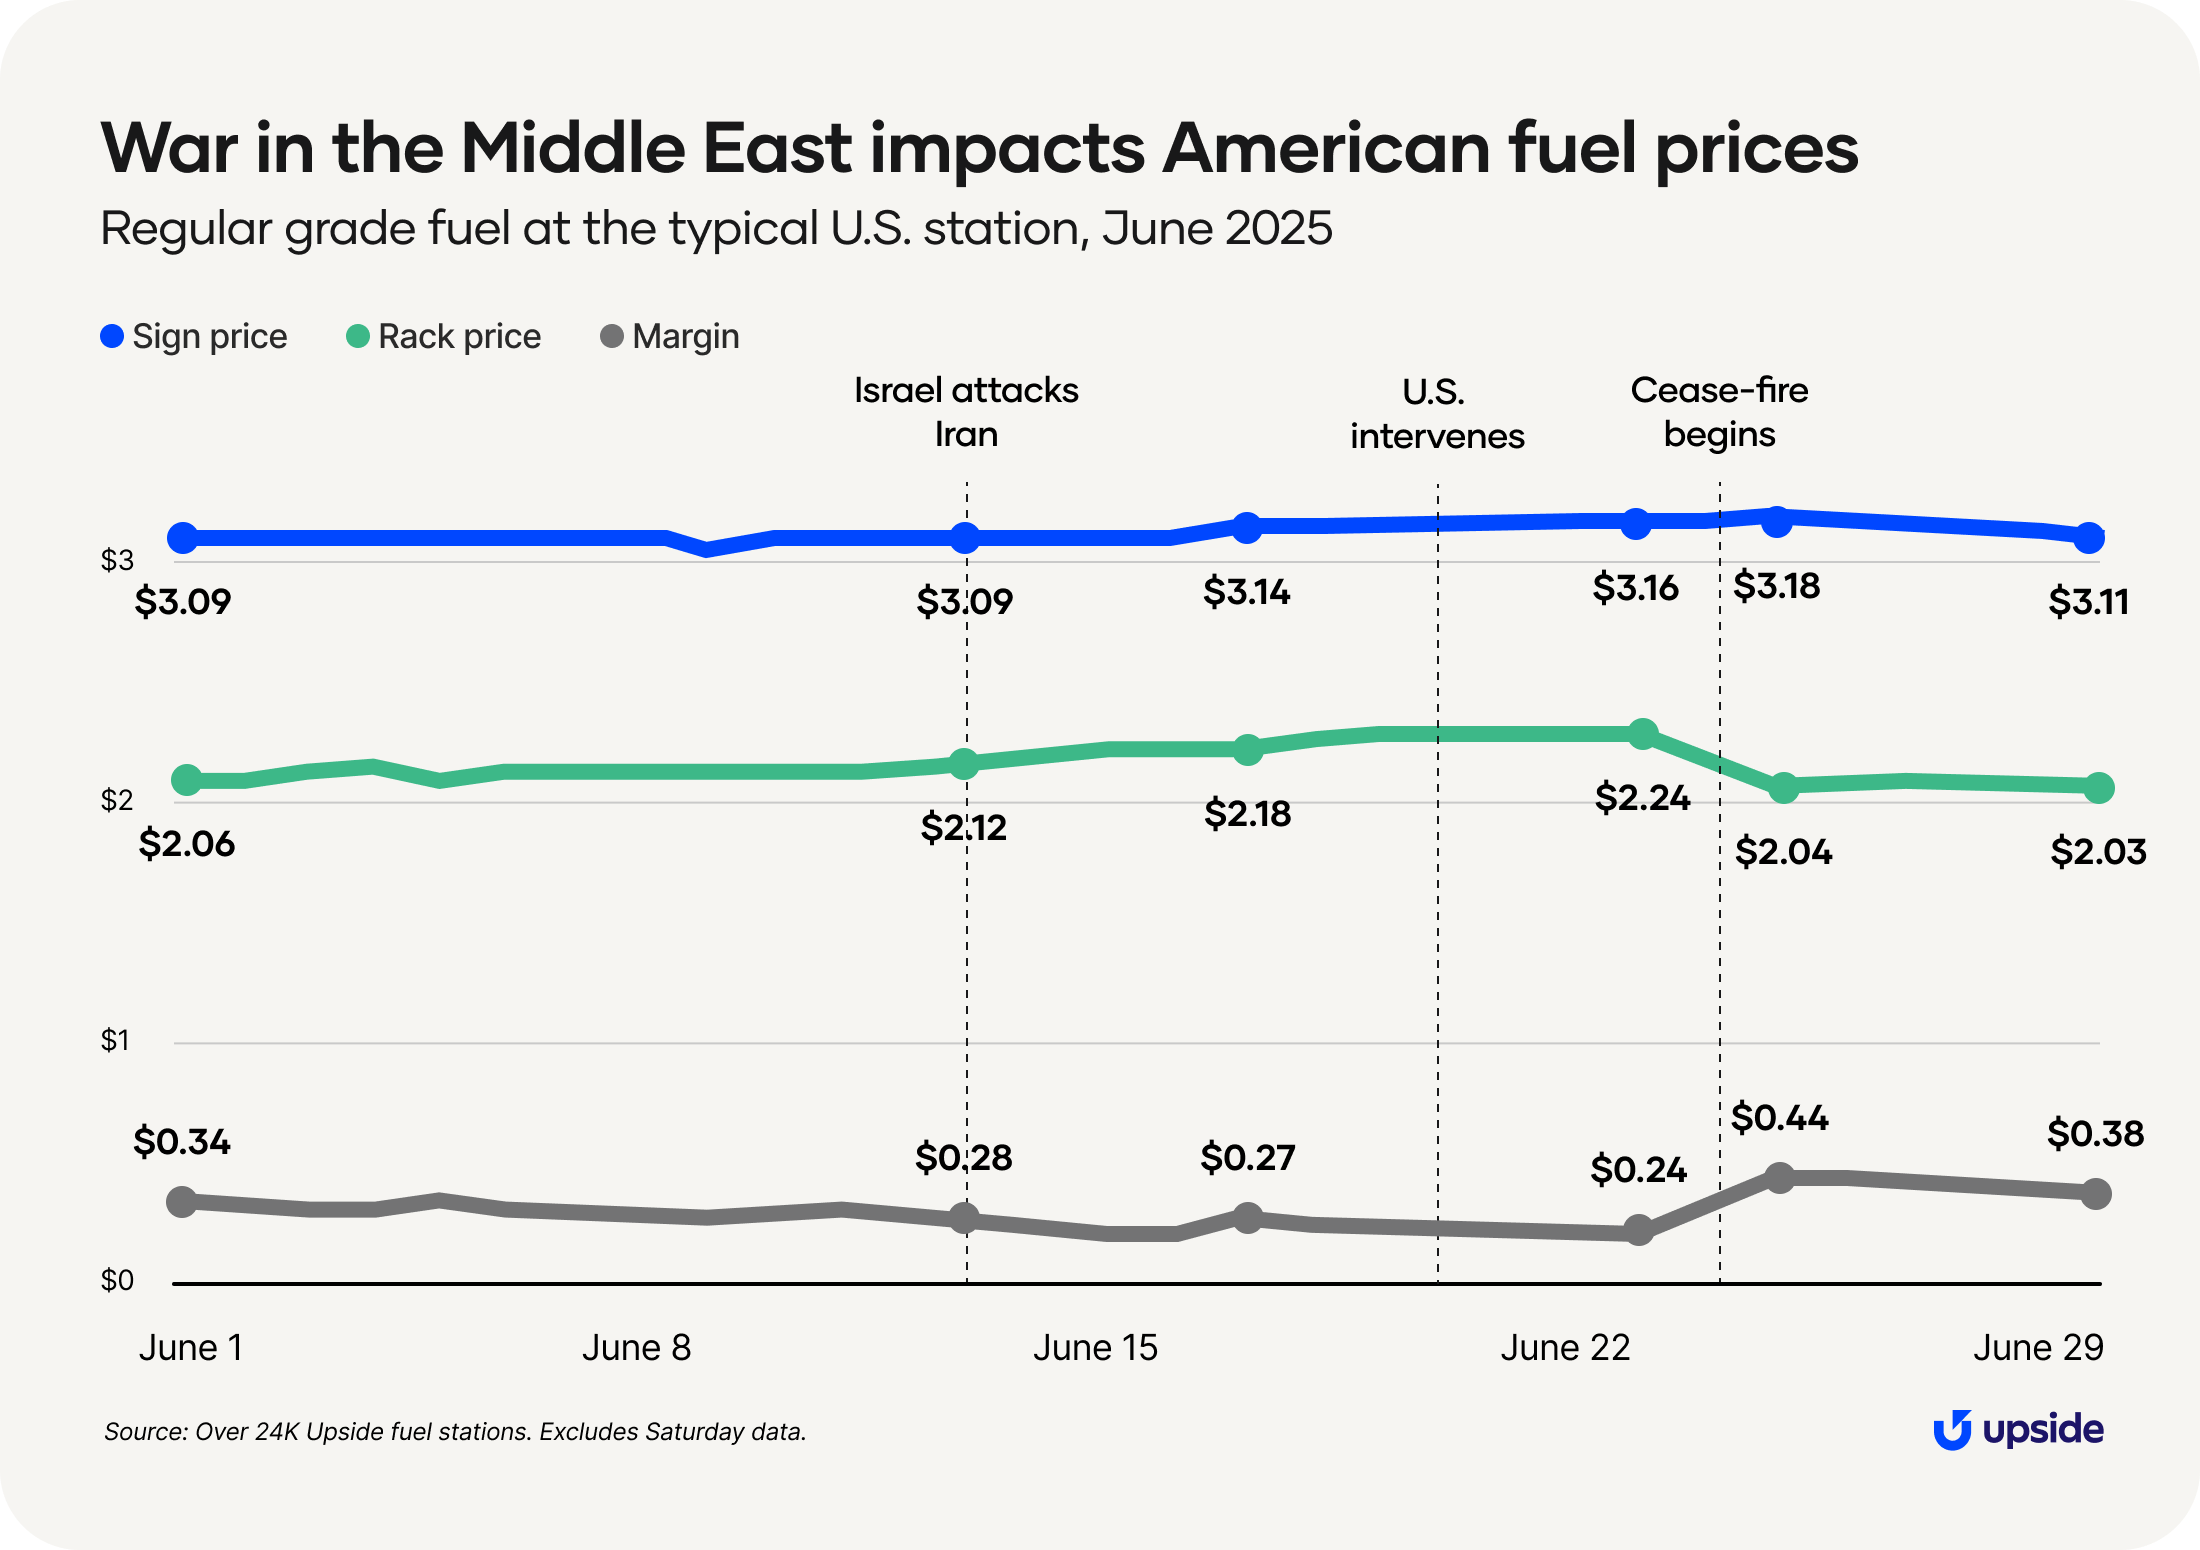
We began June with low sign prices ($3.10 per gallon of regular at the average U.S. station) due to weaker global economic growth and healthy supply from OPEC+ countries. Then on June 13, Israel made a series of surprise attacks against Iran, beginning a 12-day war between the two countries. The conflict quickly impacted rack prices, with the effects carrying through to sign prices within days — compressing margin in the process.
By June 17, rack prices had risen to $2.18, 12 cents per gallon higher than they were at the start of the month. Sign prices were at $3.14 — four cents per gallon higher — and margins had fallen to $0.27.
On June 21, the United States became directly involved by bombing underground Iranian nuclear facilities. This action drove up fear of greater escalation and that Iran would retaliate by closing the Strait of Hormuz, a strategic waterway between the Persian Gulf and Gulf of Oman through which 20% of global petroleum liquids pass.
But on June 24, just three days later, Israel and Iran enacted a ceasefire, which de-escalated tensions. Regular rack prices — typically the first metric to change — dropped to $2.04 per gallon at a typical site on June 25. Sign prices followed, albeit more slowly ($3.18 on the 25th), meaning margins temporarily remained higher ($0.44). That delay gave stations an opportunity to recover from lower profits during the previous two weeks.
By the end of the month, all three measures were within a few cents of their beginning-of-month values. Overall, the fluctuations from the war mattered at the time, but the relative brevity of the conflict helped to avoid the massive price spikes that might have occurred with greater escalation.
The effects of the conflict would have been magnified if the global supply of crude oil was more tight; however, high supply from the US and OPEC+ — combined with high refinery output — kept domestic prices relatively stable during the turmoil. The ceasefire continues to hold at the time of publication — a welcome source of stability for fuel markets.
Predictions and considerations
How will new legislation affect fuel spending?
Looking ahead to July, we expect supply to remain elevated, at least for the next few months. Strong production from OPEC+ and the United States, along with high refinery output both domestically and abroad, should translate to ample supply. Demand, too, is expected to remain high through the summer (barring any hurricane-related disruptions, of course).
An additional consideration of note: On the Fourth of July, President Trump signed the One Big Beautiful Bill Act into law.
By reducing corporate taxes, the bill may enable some retailers to reinvest in their businesses. Any consumer-side effects from the bill’s passage likely won’t be felt until 2026 at the earliest, but generally, the Congressional Budget Office says that the bill — which extends existing tax cuts and reduces federal funding for social safety net programs like SNAP — is projected to provide the largest financial gains to higher-income households, while lower-income households may see some smaller benefits or potential reductions in government support.
Potential tailwinds:
1. We’re in the midst of summer travel season, when demand for fuel hits its highest point throughout the year.
2. The Federal Reserve meets to consider another interest rate cut at the end of July. A rate cut would boost consumer spending power.
Potential headwinds:
1. The ceasefire between Israel and Iran is holding, which is good for stability in the fuel industry. But a reignition of the conflict in the Middle East could dramatically impact prices.
2. We’re in the midst of hurricane season, and we’re closely watching the weather in flood-prone regions. Hurricanes can disrupt both the supply and demand of fuel.
Want a closer look at the data?
Check out our insights hub with all our fuel and convenience monthly updates, plus special industry reports.


Request a demo
Request a demo of our platform with no obligation. Our team of industry experts will reach out to learn more about your unique business needs.

