





What we cover

In June and July, nearly a dozen American cities opened their doors to soccer fans from around the world for the FIFA World Cup. The thrilling tournament brought millions of visitors to the United States. Locals, too, got an opportunity to catch matches in their home country for the first time since 1994.
In the lead-up to the tournament, FIFA promised big benefits to host cities and their businesses. We crunched the numbers to see what fuel retailers experienced during this global celebration, and we learned that collectively, c-stores in host markets made millions more than their peers.
Read on for more.
Last month’s data
A sharp reversal of June’s substantial gains for retailers
Last month, we reported on the rise in margins per gallon, predicting the June trends would not last long. All trends come to an end, but not usually this quickly.
Not only did our prediction prove correct, but July brought a reversal that undid all of the previous month’s increases.
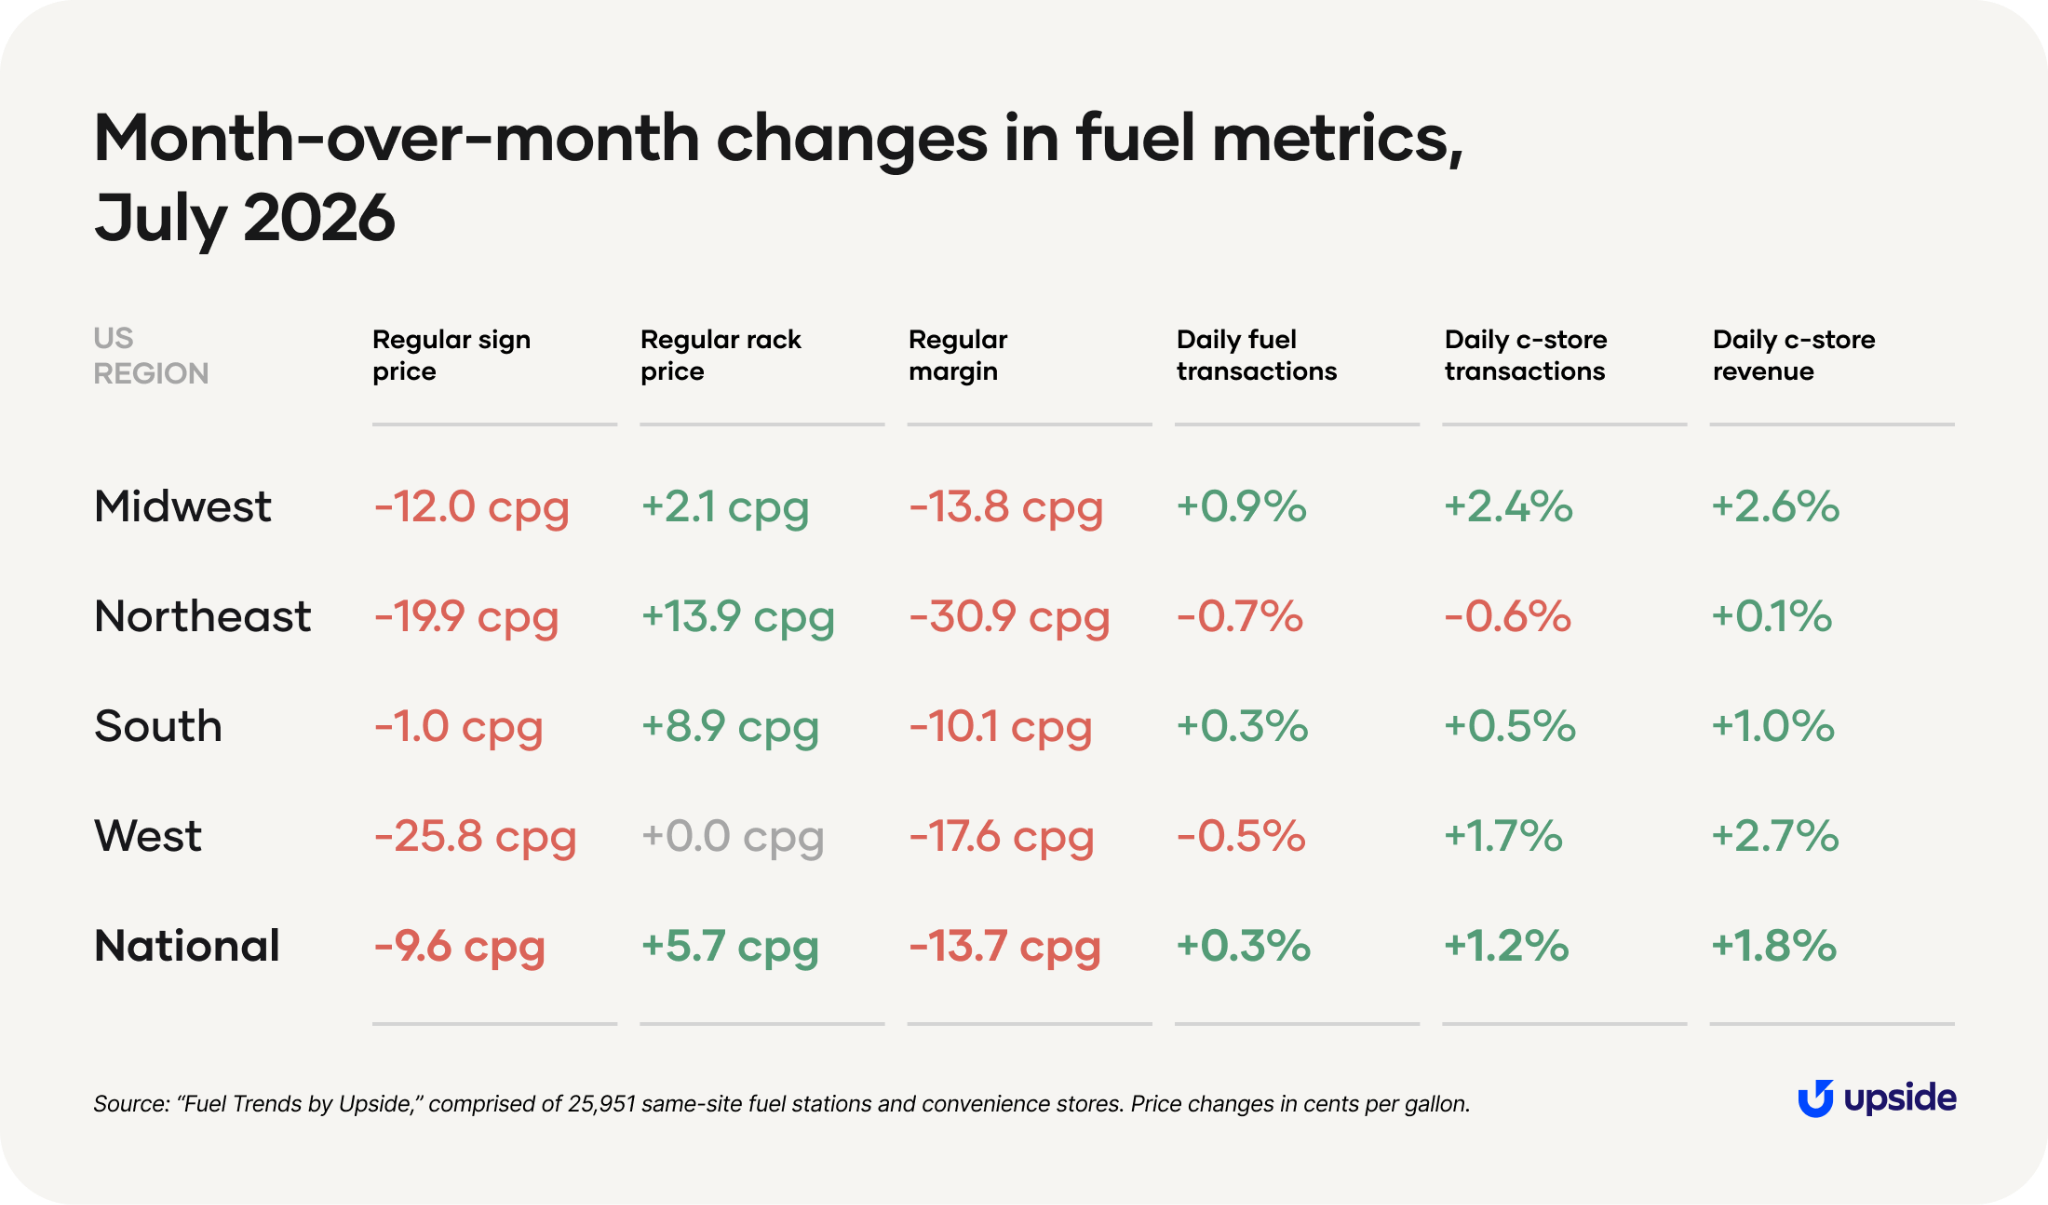
In July, the average American fuel station saw its sign prices fall while its rack prices rose. Those movements combined to push regular margins down by nearly 14 cents per gallon.
This number might confuse some fuel retailers who’d say that their sign prices were higher at the end of July than they were at the beginning. And indeed, we saw that the average sign price in America was higher on July 31st than July 1st. But here, we’re looking at month-over-month averages; the average sign price across all of July was still lower than the average price across all of June.
Usually declining sign prices are associated with rising margins, but we didn’t see that in July — both metrics decreased. Likewise, rising rack prices are usually associated with rising sign prices — but they moved in opposite directions.
We saw these two expected trends break in July, and they didn’t happen for several reasons:
- First, margins were atypically high in June as prices began falling from their elevated levels. While margins decreased in July, they are still healthy overall.
- Second, price cycles and other competitive effects put downward pressure on sign prices in July.
- Finally, there was high demand for refinery capacity in July due to lower oil prices and damaged facilities in the Persian Gulf and Russia, driving up rack prices globally.
Though these trends largely held across regions, we did see some differences. The largest changes in margin happened in the Northeast and West; stations in those regions saw the average margin per gallon of regular drop a staggering 31 cents and 18 cents, respectively.
But keep in mind that these two regions saw the highest rise in margins in June, so the substantial declines in July support our original prediction that the margin increases would be short-lived.
Meanwhile, at the pumps, demand was relatively stable across the nation. There was a slight increase in forecourt foot traffic from June to July, with the average American station seeing a 0.3% increase in daily fuel visits. Surprisingly, the regions with the largest drops in sign price (the West and Northeast) also were the only regions with month-over-month declines in fuel trips.
Inside the store, we observed stronger performance in July, with the typical US c-store seeing 1.2% more visits and 1.8% more revenue than June. And on that front, we might have the “beautiful game” to thank.
Fuel retailers score inside the store during World Cup
Last week, I attended the excellent Outlook Leadership Conference in Palos Verdes, California about the future of fuel and convenience retail.
During one of the sessions, an audience member asked about the impact of the World Cup on site traffic. I didn’t know the answer on the spot, but thankfully our Fuel Trends dashboard is built for these inquisitive questions. So let’s jump right in, no hydration break necessary.
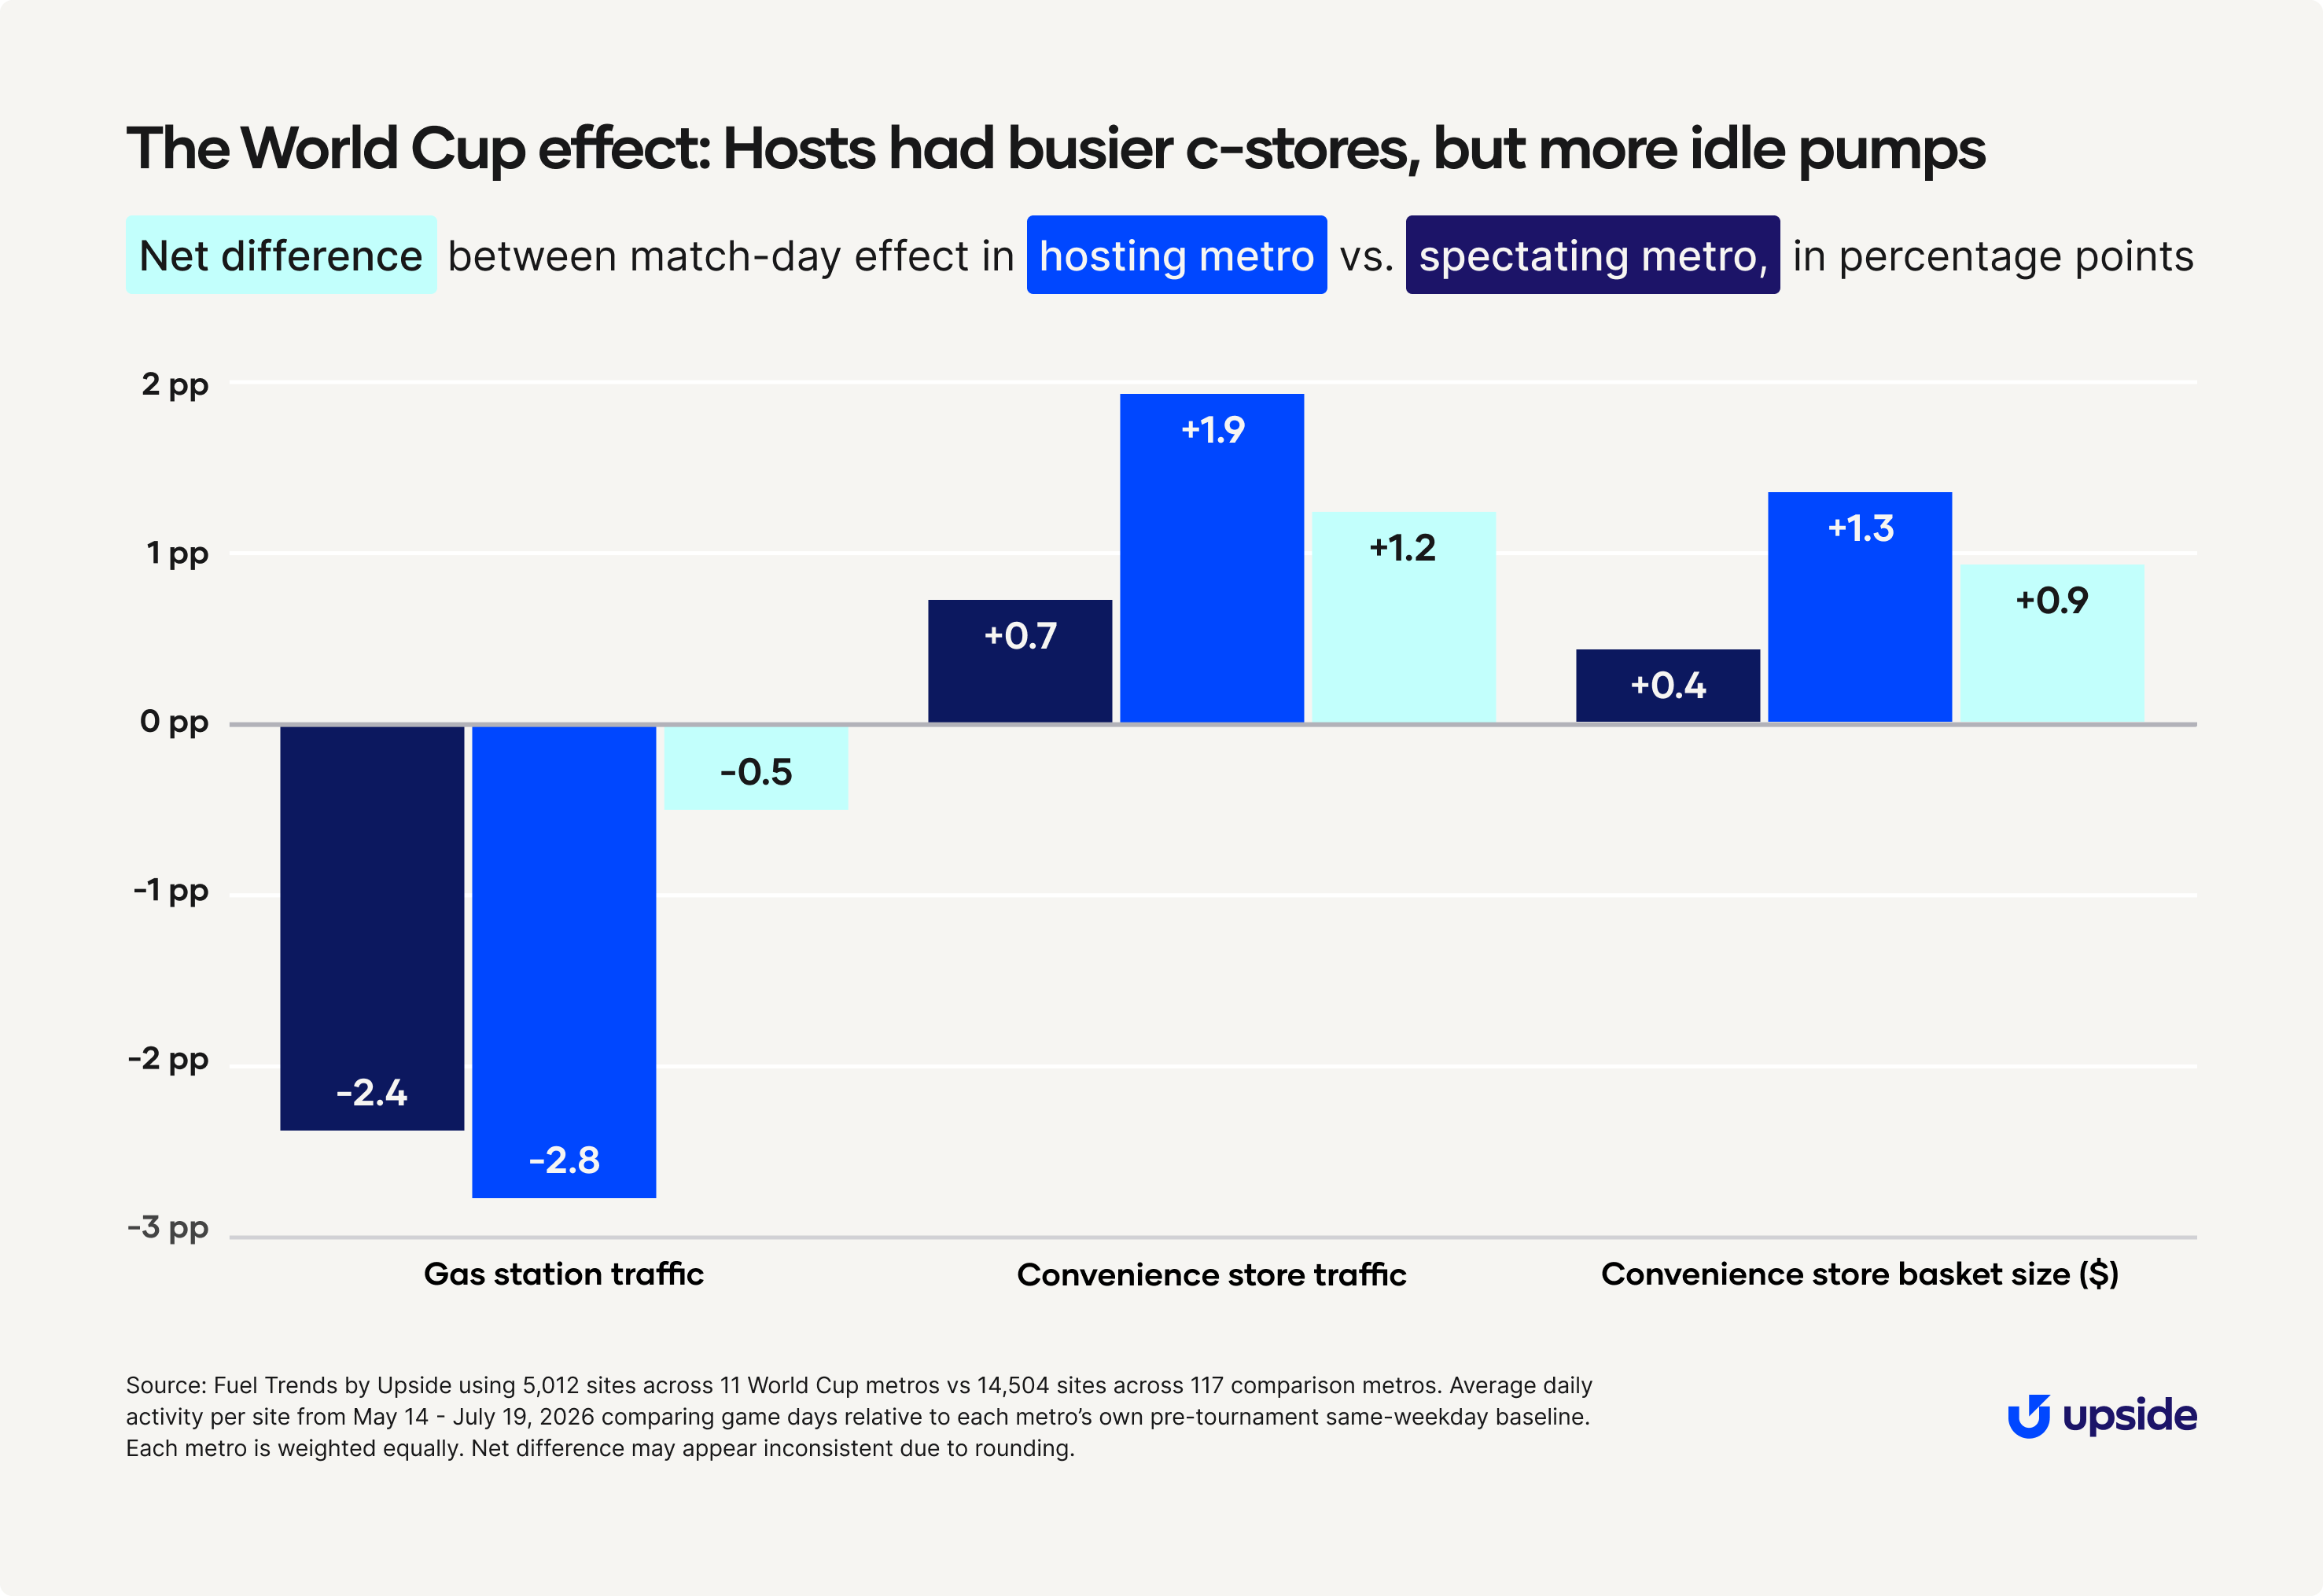
Overall, stations in metros that hosted World Cup matches saw a slight relative dip in activity at the pump, but a larger relative lift inside the c-store. (For simplicity, I’m going to refer to stations and stores in metros with matches as “hosting,” and those in metros not hosting matches as “spectating.”)
On match days, fuel traffic was slower across the nation. Hosting stations saw a slightly steeper decline in visits than their spectating peers (2.8-point drop vs. 2.4-point drop), but the net difference here is relatively small.
On the other hand, c-stores were bigger beneficiaries of the World Cup. Hosting c-stores saw significantly more foot traffic on match days than spectating stores. Inside visits increased 1.9 points for hosting stores and 0.7 points for spectating stores. This means each c-store on average saw an additional 1.2-point increase in match-day foot traffic if it was located in a metropolitan area hosting a World Cup match.
Similarly, customers at hosting c-stores also checked out with more items. Basket size at hosting stores increased by 1.3 points on match days, while the same metric increased by only 0.4 points at spectating stores.
When we convert to dollars and cents, this means that on match days, same-day customers at hosting stores would spend 8 cents more per visit.
Sounds small, to be sure. But when we combine a couple extra cents per trip with more trips overall, each hosting c-store brought in an extra $66 per match day.
And over 33 match days in June and July, across tens of thousands of stores, the true impact starts to take shape.
During the 2026 World Cup, we estimate that consumers spent an additional $12.7 million at American convenience stores in match-day metros.
Predictions and considerations
The only thing certain is the uncertain
As we push forward into August, we’re still talking about the Strait of Hormuz. Prices are still below their most elevated levels from the spring, but the conflict is ongoing. Negotiations for a full re-opening of the Strait continue, but both sides are digging in on demands that the other finds unacceptable.
New developments on a different battlefield are also worth following for the fuel industry. Ukraine is ramping up its attacks on Russian oil infrastructure in an effort to put pressure on its opponent to return to the negotiating table. Though Russia is historically a large exporter of oil, many Western nations have stopped buying its exports since it invaded Ukraine in 2022.
But the global supply is already low, and these attacks will put even more pressure on a strained system. Only an end to the supply crisis will bring relief to both consumers and retailers weary of fuel uncertainty.
Potential tailwinds:
1. Though increasing at time of publication, oil prices are still relatively lower than they were earlier in the year. Though they might feel elevated (and year-over-year, they certainly are), It’s all a matter of perspective.
2. The first two months of hurricane season have been quiet. We’ve not yet reached the peak of the season, but meteorologists anticipate a slower season than normal. Fewer natural disasters would be beneficial for an industry that’s dealing with enough disruptions already.
Potential headwinds:
1. Amid the fuel supply crisis, refineries are running at high capacity and delaying the maintenance required to ensure they can operate optimally. Delayed maintenance increases the risk of an outage, which would create yet another significant supply shock.
2. Oil reserves are low after governments and corporations tapped into their stockpiles to chip away at the supply gap. It’s just one less tool that we have to maintain stability in the industry if a further shock were to occur.
Want a closer look at the data?
Check out our insights hub with all our fuel and convenience monthly updates, plus special industry reports.
World Cup analysis: Our methodology
Curious how we calculated the impact of the World Cup at fuel stations and convenience stores? You think like an economist!
To measure the impact of the World Cup, we first look at site activity in a metro area on match days relative to a baseline (i.e., that same metro on the same day of the week for the previous four weeks before the tournament began).
If we did this alone, though, other factors happening at the same time could confound the results. For example, fluctuating gas prices or Fourth of July celebrations would end up being falsely attributed to the World Cup.
For that reason, we then make a second comparison, measuring the difference between sites in hosting metros vs sites in non-hosting metros. This quantifies the match-day impact to allow us to see specifically whether hosting a match affects fuel and convenience demand.
This approach is called a “difference-in-differences” in econometrics. It measures a difference before and after a treatment (a World Cup match) between a control group and treatment group (hosting a World Cup match).
One limitation of our analysis is that it looks at all sites within a metro area and not just those located near a hosting stadium. We consider metro areas as defined by Nielson’s designated marketing area (DMA) which can be large geographies. For example, the Boston DMA covers over half of Massachusetts as well as parts of New Hampshire and Vermont. This wide definition dampens the overall effect compared to if the analysis only considered sites closer to the hosting stadium.
Subscribe to our monthly fuel trends updates




Request a demo
Request a demo of our platform with no obligation. Our team of industry experts will reach out to learn more about your unique business needs.


