
.png)

What we cover

To this point, it’s been a quiet year for hazardous weather for most of the United States. Hurricane season, which runs from the beginning of June to the end of November annually, often brings dangerous conditions to those along the Atlantic or Gulf coasts. In August, at the peak of hurricane season, we finally did see weather that disrupted the fuel market — but it wasn’t in the South. Last month, the Midwest bore the brunt of Mother Nature’s wrath.
Read on for our full analysis of fuel trends in the month of August, including a deep dive on the impact of stormy weather for the Great Lakes region.
Last month’s data
As rack prices tick up, margins dip nationwide

Nationally, oil prices remained stable in August — with ample global supply and no major changes to demand, pump prices for regular grade fuel increased by less than a cent from the previous month, on average.
Rack prices, however, went up by more than 3 cents per gallon for regular fuel, largely due to refinery constraints. Because changes in sign prices lag behind changes in rack prices, the additional costs that retailers paid were not fully passed on to consumers, meaning retailers earned about 2 fewer cents from their margin on each regular gallon. There’s a deeper story here; below, we’ll further break down the regional differences in rack prices.
With summer demand remaining at seasonal highs, there were likewise only modest changes in foot traffic both at the pump and inside the c-store. From July to August, the average station saw a 0.5% increase in fuel transactions and a 0.2% increase in c-store transactions. There was a bit of regional disparity — Northeast stations saw dips in transactions both inside and outside the store, while stations in the West experienced gains in both places.
The national figures tell a story of stability, but a few figures are outliers here. Let’s dig into those.
Hurricane season strikes, with an unlikely victim
August is historically the peak of hurricane season; however, the American Southeast has so far been spared from any major Atlantic storms.
Last month, a major storm did impact the American fuel industry — but it was surprisingly in the Midwest. Beginning on August 18, a severe thunderstorm caused overnight flooding at an oil refinery in Whitting, Indiana, near the state’s border with Illinois. The next day, the refinery shut down multiple production units. The refinery, which produces 440,000 barrels of oil per day, is the largest in the region.
This unexpected disruption at a critical refinery reduced supply of refined gasoline for the entire region. In the next week, the average station in the Midwest experienced a 9-cent increase in regular grade rack prices. For some particular states, the effects were even larger — Indiana and its bordering states of (Illinois, Michigan, and Ohio) all saw increases larger than the regional average.
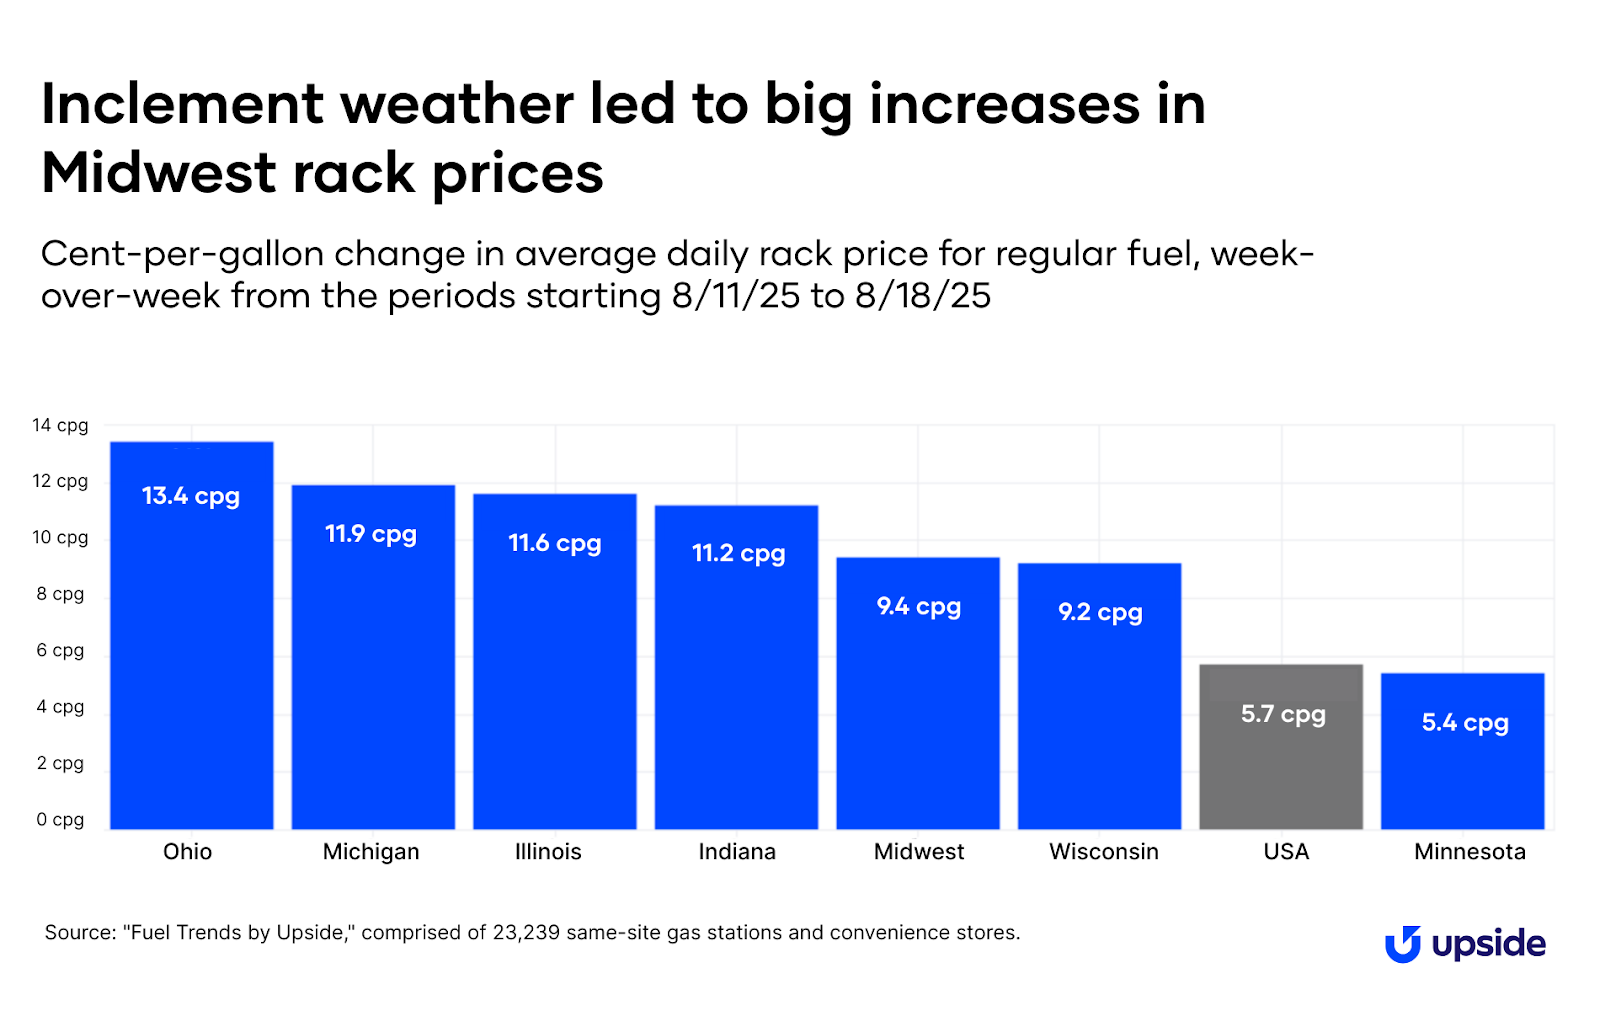
When rack prices go up, sign prices generally follow (but with an additional lag, as we mentioned above). For drivers in the Great Lakes Midwest traveling over Labor Day weekend, this supply disruption increased their travel costs.
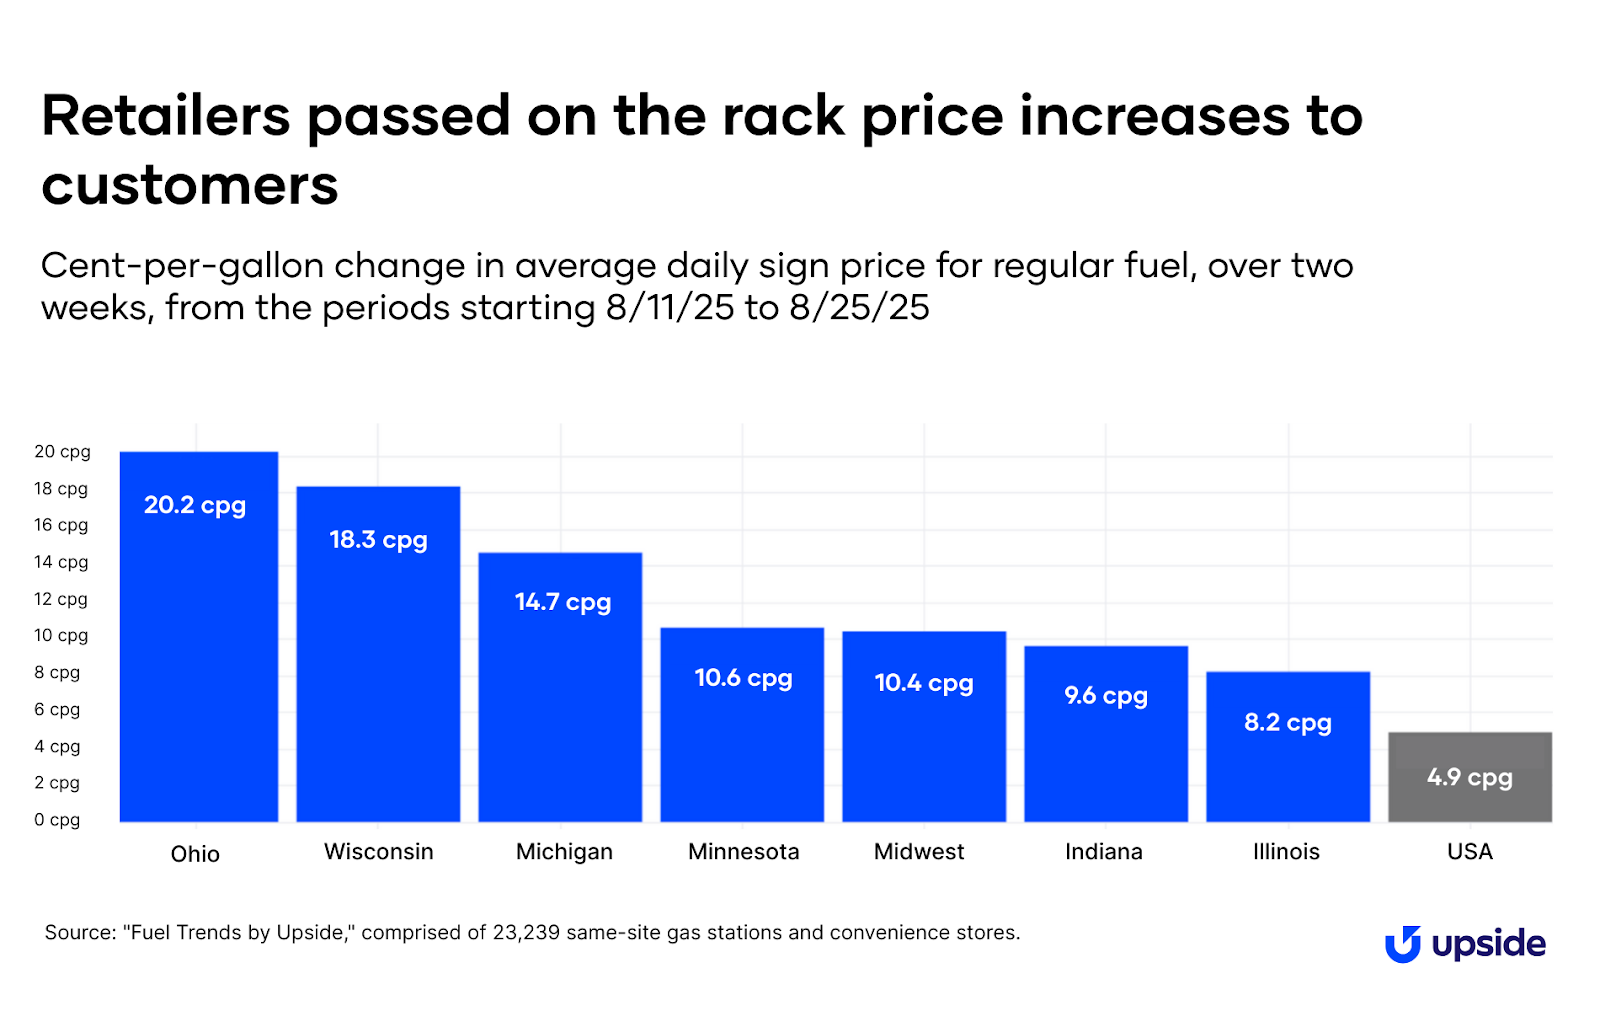
In this particular case, we see that most of the cost increases for retailers were indeed passed on to consumers during the month of August. This next chart shows the two-week change in sign prices for regular grade fuel at the average station. (We use two weeks as our measurement here because sign prices take longer to adjust than rack prices.) Over this period, the average Midwest station increased sign prices by more than 10 cents per gallon — with the largest rise happening in Ohio.
Although this increase may seem like a lot for those filling up their tank ahead of a holiday, we know from previous examples that it could have been much worse. Back in February, a refinery fire in the San Francisco Bay area led to a 30 cent-per-gallon increase in regular fuel prices in California. In Whitting, refinery operations were back to normal in under two weeks, and in the meantime, there were enough other refineries in the region to pick up the temporary slack.
Predictions and considerations
Cooler weather, cooler demand: Expect seasonal dips
The end of summer brings several trends: First, demand drops with fewer families taking vacations as school goes back in session. Second, retailer costs fall — stations are no longer required to sell the more expensive summer blend gasoline after mid-September.
The fuel industry follows these seasonal, cyclical patterns — boosts in the summer, dips in the winter, and down and up again. Fuel retailers ride a roller coaster from January to December, relying on busy months to cushion them during slower ones.
Potential tailwinds:
1. We expect high oil supply in September and through the rest of 2025, as OPEC+ recently announced another increase in its output.
2. The Federal Reserve has a highly anticipated meeting on September 17. At that meeting, most analysts expect the board will cut interest rates. When interest rates fall, consumers benefit from increased purchasing power, which can boost demand.
Potential headwinds:
1. A softening labor market and ongoing pressures from international tariffs could suppress domestic demand for fuel.
2. We’re tracking the conflict in Ukraine, because an escalation in the fighting (or increased sanctions on Russia) could lead to higher oil costs.
3. Hurricane season isn’t over yet, and any inclement weather could lead to supply or demand disruptions — just as we saw in August.
Want a closer look at the data?
Check out our insights hub with all our fuel and convenience monthly updates, plus special industry reports.


Request a demo
Request a demo of our platform with no obligation. Our team of industry experts will reach out to learn more about your unique business needs.

